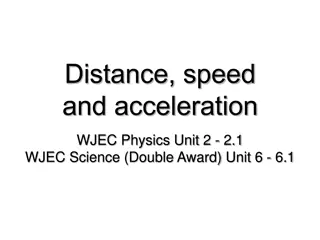
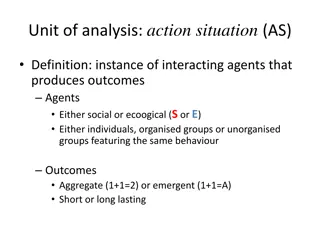
Understanding Speed of Movement in Different Situations


Speed of Movement
Measuring the speed of a moving object in different situations


Speed of Movement
Measuring the speed of a moving object in different situations
Objective
The purpose of this activity is to analyze the change in the speed of
an object in different situations, creating an hypothesis and
proceeding to test it, using the SensorLab built-in GPS sensor.
The aim of the introduction is to focus students on the class subject by refreshing
acquired knowledge and asking questions which encourage research development.
Then, key concepts of the theoretical framework, used by the students during the
class, are taught.
Introduction and theory


Introduction
Every day we move without considering the parameters that rule our movements.
Therefore, we never usually notice the changes in speed that are produced when we are in
hurry, need to run or change transportation in order to get somewhere more quickly.
Speed of Movement

Measuring the speed of a moving object in different situations
Introduction and theory
At the end of this class, you’ll be able to answer the following question and investigate!
What parameters other than speed are related to the movement of a body?
Speed of Movement
Measuring the speed of a moving object in different situations
How does the speed of a person performing different activities vary in time?
Theoretical background
Speed can be defined as the rate at which an object covers distance. Doubling one’s
speed would mean doubling the distance traveled in a given amount of time, or
halving the time required to travel a given distance. In other words it refers to “how
fast an object is moving”, and therefore is expressed as a function of time and
distance, in following formula:
s = distance covered (m).
t = time (s).
From the formula you can understand that speed is measured with units of distance
per units of time, e.g. meters/seconds, kilometer/hour, etc.
Introduction and theory
Speed of Movement
Measuring the speed of a moving object in different situations
Introduction and theory
It is common to use the term “velocity” as a synonym of “speed”, but they are not
the same. While speed is a scalar quantity, velocity is a vector quantity. It therefore
has a direction and a magnitude, and can be expressed geometrically with an arrow
starting from point A (reference point) to a point B (as shown in the image below). It
refers to “the rate at which an object changes its position”, and is not expressed as
the rate of change of distance in time, but of displacement in time.
Speed of Movement
Measuring the speed of a moving object in different situations
Introduction and theory
Let’s take an example of a moving object like a car, travelling at 100 km/h on the
highway in a northerly direction, has a velocity vector given by:
Magnitude: 100 Km/h
Direction: North to south
Speed, on the other hand, is the magnitude of the velocity; in this case 100 Km/h.
Acceleration is the rate at which velocity changes in a given time period. Therefore, a
car that changes its velocity in a time period is said to “accelerate”.
The formula for acceleration is :
Speed of Movement
Measuring the speed of a moving object in different situations
Introduction and theory
Speed of Movement
Measuring the speed of a moving object in different situations
What would you say is the normal speed range of a person walking, jogging
and running? How does it vary between different people?
Now students are encouraged to raise an hypothesis which must be tested with an
experiment.
Activity description
During the activity, students will measure the speed of different people walking,
jogging and running. The results will be plotted creating graphs, which will be
analyzed and compared.
Speed of Movement
Measuring the speed of a moving object in different situations
SensorLab
Resources and materials
Speed of Movement
Measuring the speed of a moving object in different situations
Using the SensorLab
a.
Using the SensorLab
To collect measurements with the built-in GPS sensor, the SensorLab data logger must be
configured according to the following steps:
Turn on the SensorLab pressing .
Press ,
and select “SETUP” by pressing .
Now select the option “SET SENSORS” with .
Select only the GPS sensor and then press .
Once you have done that, you will be back at the setup, press one time and
select “SAMPLING RATE” with .
Select “1/sec” with and then press .
Press and select “NUMBER OF SAMPLES” with .
Speed of Movement
Measuring the speed of a moving object in different situations
Using the SensorLab
Select “10000” with and then press .
With the button select “Configuration” and press .
Press one time and select “GPS Configuration” with .
Select the option “GPS enabled” with and select with .
Speed of Movement
Measuring the speed of a moving object in different situations
Select “10000” with and then press .
To go back to the measurements press three times.
Then press to start measuring.
Once you are finished with the measuring stop the SensorLab. To do so, press
(you will see the instruction “Press SCROLL key to STOP”) and press .
Experiment
The following steps explain how to perform the experiment:
Find a big open space next to your school where you can move freely (maybe the school
yard).
Speed of Movement
Measuring the speed of a moving object in different situations
One student will hold the SensorLab and start walking. After 30 seconds he/she will start
jogging, and finally start running after another 30 seconds (*).
When you have finished measuring, stop the sensor.
Repeat the experiment with other students, so you can later compare their different
results.
(*) The activity may be designed differently, for example using bikes or during a relay
race. Each member of the team must perform the entire activity.
Results and analysis
The following steps explain how to analyze the experiment results:
Connect the SensorLab to the computer.
On the upper menu press the button and select .
Select the last experiment of the list.
Observe the graph displayed on the screen.
Press the button and write notes on the graph specifying the activity you were
performing (running, jogging, walking).
Press to select data points on the graph and pick one representative point for
each activity.
Speed of Movement
Measuring the speed of a moving object in different situations
Results and analysis
On the upper tool menu, press the button and select . - the map of the
experiment will appear on the screen.
Right-click the mouse on the graph scale and select “GPS speed”.
Fit the graph range clicking with the right button of the mouse on the graph range and
select “set range”.
Select 0 as the minimum value and as the maximum a slightly higher value than the one
obtained by the student. To check the measurement, look at the speed versus time graph
in step 4.
Repeat the former steps, selecting in step 3 the last experiment but one, to observe the
graph of the two students who executed the activities.
Speed of Movement
Measuring the speed of a moving object in different situations
Results and analysis
If you want to send data by Bluetooth, synchronize the laptop with the SensorLab by
clicking the “Bluetooth Configuration” menu in the sensor.
Start the GlobiLab software and right-click the symbol in the lower right corner of
the screen.
Select the SensorLab, download the data and process the graph following steps 2 to 6.
Speed of Movement
Measuring the speed of a moving object in different situations
Results and analysis
What differences did you find between the graphs and the activity maps of
the students? What similarities did you find?
During which activity did you obtain the highest and the lowest speed value?
Speed of Movement
Measuring the speed of a moving object in different situations
How did the speed of each student vary? What were the lowest and the
highest speed values?
How would you explain the separations between the spots marked on the map?
Results and analysis
The graph below should be similar to the one the students came up with.
Speed of Movement
Measuring the speed of a moving object in different situations
Results and analysis
Map of speed as a function of time:
Speed of Movement
Measuring the speed of a moving object in different situations
Conclusions
Describe the graphs you obtained, explaining the magnitude of acceleration and
deceleration as a function of time.
Students should explain the graphs describing the periods in which acceleration
occurred. For example, in the map shown earlier, the student increases the speed
(accelerated) for 4 seconds, until a speed of 7 km/hour. Next the student kept this
speed constant for a period of 26 seconds. Then the student accelerated again for 8
seconds until a speed value of approximately 13 km/hour, and maintained this speed
for about 6 seconds. 43 seconds after starting the student decelerated to a speed of 11
km/hour. The student then raised the speed again for 10 seconds, achieving a
speed of 27 km/hour. 60 seconds after the start the student decelerated again until the
completion of the experiment.
Hereafter are presented some questions and answers which should be developed by
the students in order to elaborate their conclusions.
Speed of Movement
Measuring the speed of a moving object in different situations
Conclusions
According to the previous question, how can the speed of a person vary during the
day?
Students should explain that the speed of a person changes increasing or decreasing
according to the activity being performed. They should point out some standard
speed of movement values, e.g. the person represented in the previous graph
achieved a walking speed of 5 km/hour and 27 km/hour when he was running.
What way would be the most efficient to learn which one of the two students was
the slowest and which the fastest one?
Students should understand that the easiest and fastest way to determine the highest
and lowest speed value is by analyzing the graph, comparing the minimum and
maximum values. You can also analyze data charts, finding maximum and minimum
values for each subject. However, this way is more complicated and slow than the
first.
Speed of Movement
Measuring the speed of a moving object in different situations
Conclusions
Students should reach the following conclusions:
A person’s speed changes according to the activity he or she performs. Movement is
always a continuum of accelerations and decelerations. On the other hand, while we
are carrying out a determined activity like walking, speed can keep quite constant in
time.
Observing the GPS map we can observe that the separations of the measurements
become greater each time, while the time period between each spot is constant (1
per second). This may be explained because as speed rises, the distance covered in
each time period increases, indicating acceleration.
Speed of Movement
Measuring the speed of a moving object in different situations
Activities for further application
What factors restrict the maximum velocity that a living organism may achieve?
Students should think of their experience, and point out that we may find biotic and
abiotic factors that may limit speed. For example, abiotic factors depending of the
interaction of the organism with the surrounding environment would be viscosity, the
amount of obstacles present in the surroundings, etc. Biotic factors referring to
physiology may be the body’s elasticity, the length of the limbs, the particular
adaptations to the environment, etc.
The aim of this section is so that the students can extrapolate the acquired
knowledge during this class through the application of it in different contexts and
situations. Furthermore, it is intended that students present possible explanations to
the experimentally observed phenomena.
Next, answers to the stated questions are presented.
Speed of Movement
Measuring the speed of a moving object in different situations
Activities for further application
How does a car speedometer work?
Students should think of their experience, and investigate to establish that a
speedometer measures the instant speed of the car, i.e. the speed achieved during a
very small period of time. To measure the distance, the speedometer measures the
amount of times the wheel turns. With the perimeter of the wheel and the turning
of the wheel you can calculate the distance covered, while the time is measured
with an internal chronometer.
Speed of Movement
Measuring the speed of a moving object in different situations
Activities for further application
According to the image, what would be the fastest way to save the person drowning?
Students should establish that the lifeguard should take path B, because we are more
adapted to run on the sand than to swim, and therefore are at faster running than
swimming. Because of that even if the B path is a longer distance to cover, the person
will probably take less time to achieve the goal and save the person drowning. This is an
example of biotic and abiotic factors that may interfere with the speed of movement.
Speed of Movement
Measuring the speed of a moving object in different situations
Activities for further application
Speed of Movement
Measuring the speed of a moving object in different situations
If you plot the speed of five different people walking, then jogging and finally
running, how would the graphs be similar? What differences would you find?
Student should find as a similarity that all persons will probably be faster at jogging
than walking, and even faster at running than jogging. On the other hand, minimum
and maximum values will probably be different per activity for each person, because
everyone has a different range of variation.
Exploring the concept of speed in the context of moving objects, this activity aims to analyze changes in speed, create hypotheses, and test them using a built-in GPS sensor. The theoretical background covers the definition of speed, its relation to distance and time, as well as the distinction between speed and velocity as scalar and vector quantities respectively. Through this study, participants will investigate how speed varies in different activities and scenarios.

Download Presentation

Please find below an Image/Link to download the presentation.
The content on the website is provided AS IS for your information and personal use only. It may not be sold, licensed, or shared on other websites without obtaining consent from the author. Download presentation by click this link. If you encounter any issues during the download, it is possible that the publisher has removed the file from their server.
E N D
Presentation Transcript
Speed of Movement Measuring the speed of a moving object in different situations
Speed of Movement Measuring the speed of a moving object in different situations Objective The purpose of this activity is to analyze the change in the speed of an object in different situations, creating an hypothesis and proceeding to test it, using the SensorLab built-in GPS sensor.
Speed of Movement Measuring the speed of a moving object in different situations Introduction and theory The aim of the introduction is to focus students on the class subject by refreshing acquired knowledge and asking questions which encourage research development. Then, key concepts of the theoretical framework, used by the students during the class, are taught. Introduction Every day we move without considering the parameters that rule our movements. Therefore, we never usually notice the changes in speed that are produced when we are in hurry, need to run or change transportation in order to get somewhere more quickly. In what other situations do we change our speed?
Speed of Movement Measuring the speed of a moving object in different situations Introduction and theory What parameters other than speed are related to the movement of a body? At the end of this class, you ll be able to answer the following question and investigate! How does the speed of a person performing different activities vary in time?
Speed of Movement Measuring the speed of a moving object in different situations Introduction and theory Theoretical background Speed can be defined as the rate at which an object covers distance. Doubling one s speed would mean doubling the distance traveled in a given amount of time, or halving the time required to travel a given distance. In other words it refers to how fast an object is moving , and therefore is expressed as a function of time and distance, in following formula: s = distance covered (m). t = time (s). From the formula you can understand that speed is measured with units of distance per units of time, e.g. meters/seconds, kilometer/hour, etc.
Speed of Movement Measuring the speed of a moving object in different situations Introduction and theory It is common to use the term velocity as a synonym of speed , but they are not the same. While speed is a scalar quantity, velocity is a vector quantity. It therefore has a direction and a magnitude, and can be expressed geometrically with an arrow starting from point A (reference point) to a point B (as shown in the image below). It refers to the rate at which an object changes its position , and is not expressed as the rate of change of distance in time, but of displacement in time.
Speed of Movement Measuring the speed of a moving object in different situations Introduction and theory Let s take an example of a moving object like a car, travelling at 100 km/h on the highway in a northerly direction, has a velocity vector given by: Magnitude: 100 Km/h Direction: North to south Speed, on the other hand, is the magnitude of the velocity; in this case 100 Km/h. Acceleration is the rate at which velocity changes in a given time period. Therefore, a car that changes its velocity in a time period is said to accelerate . The formula for acceleration is :
Speed of Movement Measuring the speed of a moving object in different situations Introduction and theory Now students are encouraged to raise an hypothesis which must be tested with an experiment. What would you say is the normal speed range of a person walking, jogging and running? How does it vary between different people?
Speed of Movement Measuring the speed of a moving object in different situations Activity description During the activity, students will measure the speed of different people walking, jogging and running. The results will be plotted creating graphs, which will be analyzed and compared.
Speed of Movement Measuring the speed of a moving object in different situations Resources and materials SensorLab
Speed of Movement Measuring the speed of a moving object in different situations Using the SensorLab a. Using the SensorLab To collect measurements with the built-in GPS sensor, the SensorLab data logger must be configured according to the following steps: Turn on the SensorLab pressing . Press , and select SETUP by pressing . Now select the option SET SENSORS with . Select only the GPS sensor and then press . Once you have done that, you will be back at the setup, press one time and select SAMPLING RATE with . Select 1/sec with and then press . Press and select NUMBER OF SAMPLES with .
Speed of Movement Measuring the speed of a moving object in different situations Using the SensorLab Select 10000 with and then press . With the button select Configuration and press . Press one time and select GPS Configuration with . Select the option GPS enabled with and select with . Select 10000 with and then press . To go back to the measurements press three times. Then press to start measuring. Once you are finished with the measuring stop the SensorLab. To do so, press (you will see the instruction Press SCROLL key to STOP ) and press .
Speed of Movement Measuring the speed of a moving object in different situations Experiment The following steps explain how to perform the experiment: Find a big open space next to your school where you can move freely (maybe the school yard). One student will hold the SensorLab and start walking. After 30 seconds he/she will start jogging, and finally start running after another 30 seconds (*). When you have finished measuring, stop the sensor. Repeat the experiment with other students, so you can later compare their different results. (*) The activity may be designed differently, for example using bikes or during a relay race. Each member of the team must perform the entire activity.
Speed of Movement Measuring the speed of a moving object in different situations Results and analysis The following steps explain how to analyze the experiment results: Connect the SensorLab to the computer. On the upper menu press the button and select . Select the last experiment of the list. Observe the graph displayed on the screen. Press the button and write notes on the graph specifying the activity you were performing (running, jogging, walking). Press to select data points on the graph and pick one representative point for each activity.
Speed of Movement Measuring the speed of a moving object in different situations Results and analysis On the upper tool menu, press the button and select . - the map of the experiment will appear on the screen. Right-click the mouse on the graph scale and select GPS speed . Fit the graph range clicking with the right button of the mouse on the graph range and select set range . Select 0 as the minimum value and as the maximum a slightly higher value than the one obtained by the student. To check the measurement, look at the speed versus time graph in step 4. Repeat the former steps, selecting in step 3 the last experiment but one, to observe the graph of the two students who executed the activities.
Speed of Movement Measuring the speed of a moving object in different situations Results and analysis If you want to send data by Bluetooth, synchronize the laptop with the SensorLab by clicking the Bluetooth Configuration menu in the sensor. Start the GlobiLab software and right-click the symbol in the lower right corner of the screen. Select the SensorLab, download the data and process the graph following steps 2 to 6.
Speed of Movement Measuring the speed of a moving object in different situations Results and analysis During which activity did you obtain the highest and the lowest speed value? What differences did you find between the graphs and the activity maps of the students? What similarities did you find? How did the speed of each student vary? What were the lowest and the highest speed values? How would you explain the separations between the spots marked on the map?
Speed of Movement Measuring the speed of a moving object in different situations Results and analysis The graph below should be similar to the one the students came up with.
Speed of Movement Measuring the speed of a moving object in different situations Results and analysis Map of speed as a function of time:
Speed of Movement Measuring the speed of a moving object in different situations Conclusions Hereafter are presented some questions and answers which should be developed by the students in order to elaborate their conclusions. Describe the graphs you obtained, explaining the magnitude of acceleration and deceleration as a function of time. Students should explain the graphs describing the periods in which acceleration occurred. For example, in the map shown earlier, the student increases the speed (accelerated) for 4 seconds, until a speed of 7 km/hour. Next the student kept this speed constant for a period of 26 seconds. Then the student accelerated again for 8 seconds until a speed value of approximately 13 km/hour, and maintained this speed for about 6 seconds. 43 seconds after starting the student decelerated to a speed of 11 km/hour. The student then raised the speed again for 10 seconds, achieving a speed of 27 km/hour. 60 seconds after the start the student decelerated again until the completion of the experiment.
Speed of Movement Measuring the speed of a moving object in different situations Conclusions According to the previous question, how can the speed of a person vary during the day? Students should explain that the speed of a person changes increasing or decreasing according to the activity being performed. They should point out some standard speed of movement values, e.g. the person represented in the previous graph achieved a walking speed of 5 km/hour and 27 km/hour when he was running. What way would be the most efficient to learn which one of the two students was the slowest and which the fastest one? Students should understand that the easiest and fastest way to determine the highest and lowest speed value is by analyzing the graph, comparing the minimum and maximum values. You can also analyze data charts, finding maximum and minimum values for each subject. However, this way is more complicated and slow than the first.
Speed of Movement Measuring the speed of a moving object in different situations Conclusions Students should reach the following conclusions: A person s speed changes according to the activity he or she performs. Movement is always a continuum of accelerations and decelerations. On the other hand, while we are carrying out a determined activity like walking, speed can keep quite constant in time. Observing the GPS map we can observe that the separations of the measurements become greater each time, while the time period between each spot is constant (1 per second). This may be explained because as speed rises, the distance covered in each time period increases, indicating acceleration.
Speed of Movement Measuring the speed of a moving object in different situations Activities for further application The aim of this section is so that the students can extrapolate the acquired knowledge during this class through the application of it in different contexts and situations. Furthermore, it is intended that students present possible explanations to the experimentally observed phenomena. Next, answers to the stated questions are presented. What factors restrict the maximum velocity that a living organism may achieve? Students should think of their experience, and point out that we may find biotic and abiotic factors that may limit speed. For example, abiotic factors depending of the interaction of the organism with the surrounding environment would be viscosity, the amount of obstacles present in the surroundings, etc. Biotic factors referring to physiology may be the body s elasticity, the length of the limbs, the particular adaptations to the environment, etc.
Speed of Movement Measuring the speed of a moving object in different situations Activities for further application How does a car speedometer work? Students should think of their experience, and investigate to establish that a speedometer measures the instant speed of the car, i.e. the speed achieved during a very small period of time. To measure the distance, the speedometer measures the amount of times the wheel turns. With the perimeter of the wheel and the turning of the wheel you can calculate the distance covered, while the time is measured with an internal chronometer.
Speed of Movement Measuring the speed of a moving object in different situations Activities for further application According to the image, what would be the fastest way to save the person drowning? Students should establish that the lifeguard should take path B, because we are more adapted to run on the sand than to swim, and therefore are at faster running than swimming. Because of that even if the B path is a longer distance to cover, the person will probably take less time to achieve the goal and save the person drowning. This is an example of biotic and abiotic factors that may interfere with the speed of movement.
Speed of Movement Measuring the speed of a moving object in different situations Activities for further application If you plot the speed of five different people walking, then jogging and finally running, how would the graphs be similar? What differences would you find? Student should find as a similarity that all persons will probably be faster at jogging than walking, and even faster at running than jogging. On the other hand, minimum and maximum values will probably be different per activity for each person, because everyone has a different range of variation.