Exploring Wind Power: Statistical and Economic Project Comparisons

Delve into the world of wind power with this informative content covering the origins of wind, effects of Earth's rotation on wind patterns, and the impact of elevation on wind speed. Learn about the calculations and units involved in wind energy analysis, providing a comprehensive overview of this renewable energy source.

Download Presentation

Please find below an Image/Link to download the presentation.
The content on the website is provided AS IS for your information and personal use only. It may not be sold, licensed, or shared on other websites without obtaining consent from the author. Download presentation by click this link. If you encounter any issues during the download, it is possible that the publisher has removed the file from their server.
E N D
Presentation Transcript
Power in the Wind: Making Statistical and Economic Project Comparisons April 22, 2016 This work is licensed under a Creative Commons Attribution- NonCommercial-ShareAlike 4.0 International License.
Where Does the Wind Come From? Uneven heating of the Earth What if the Earth did not rotate? CC BY-SA 3.0, http://scioly.org/wiki/index.php/Meteorology/ Everyday_Weather https://commons.wikimedia.org/w/index.php?curi d=2310777
Where Does the Wind Come From? Add rotation (and thus the Coriolis effect) and what happens? Global Winds "Earth Global Circulation - en" by Kaidor - Own work based on File:Earth Global Circulation.jpgThe picture of the Earth is File:Lunar eclipse from moon-2007Mar03.png vectorized with Inkscape.. Licensed under CC BY-SA 3.0 via Commons - https://commons.wikimedia.org /wiki/File:Earth_Global_Circulat ion_-_en.sv... (link is external)
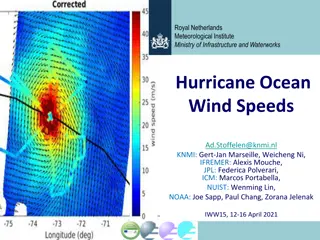
Where Does the Wind Come From? Secondary and tertiary circulations also occur around the earth Secondary Hurricanes (tropical cyclones) Extratropical cyclones Tertiary Uneven heating due to terrain or surface proprties Land/sea breezes Mountain/valley breezes Thunderstorms Tornadoes Land and sea breezes compared License: CC BY-NC 3.0 Source: https://www.e- education.psu.edu/geog497i/node/329
What Happens to the Wind as you Go Up in Elevation? A sample graph of wind speeds from 0 to 140 m Source: NREL
Power in the Wind Foundations mass volume m V kg m Density Volume Velocity Power Energy = = = [ ] 3 = = 3 * [ ] area length AL m length time energy time L t J s= m s = = [ ] = [ ] W 1 2 1 2 = = = 2 2 . . *( ) [ ] J K E mass velo city mv Come up with an equation for power as a function only of Area, Velocity and Density: 1 2 1 2 1 2 V v AL v 2 2 2 ( ) ( ) mv . . E t 1 2 K = = = = = 3 Pow e r Av t t t
Power in the Wind kg m s N m Let s check our units: = N 2 1 2 = J = 3 P Av W 3 2 kg m m s kg m s = 2 m 3 3 2 = kg m s N m s J s Watt = = 3
Let's say we'd like to know how much power is available in the wind flowing through a hula-hoop (D= 1 m) for a wind speed of 10 m/s: A Boeing 747 has an approximate "diameter" of 65 m, but the rotor shown in the figure below has a diameter of 80 m. How much power is available in the wind for a turbine of this size at a velocity of 10 m/s? Using the 747 example from above, note the differences in available power just by increasing the velocity of the wind by a factor of two from 10 m/s to 20 m/s:
Influence of Air Density Lets Investigate How Air Density Changes? Let s look at the Ideal Gas Law = PV nR T P= pressure, V = volume, n = # moles, T = temperature, is the ideal gas constant 8.314 kJ/kg-K We are going to reconfigure this to solve for density and apply it specifically to air. R
Ideal Gas Law mass basis First we need to move from moles to mass: m M = n M is the molecular weight of the substance you are using, and m is the mass. RT = = PV mM mRT Where R is now a constant specific to the gas used in the equation.
Ideal Gas Law - rearranging We know that density is mass/Volume, so let s reorganize the terms to solve for this: m V P = = RT For air, R = 286.9 J/kg-K Mainly composed of 78% Nitrogen (R=296.8 J/kg- K) & 21% Oxygen (R=259.8J/kg-K)
Ideal Gas Law Example Example: Calculate the air density for standard atmospheric conditions, T = 15C, P = 101.325 kPa (Pa = N/m2): [ ] = kg m P Pa J kg K 3 [ ] T K R 101,325[ J kg K ] kg m Pa kg m = = 1.225 3 3 (15 273.15)[ ] + 287 K
Density Conclusion Density increases with increasing pressure and decreases with increasing temperature: P = RT As air rises, it becomes cooler and the pressure decreases, thus density will? decrease
What Happens to Air Density in the Mile High City? What Happens to Air Density in Cold Weather?
Weibull Distribution (for your information) Shape factor k Scale factor (m/s)
1 2 = 3 turbine P C Av p
Calculating Energy Production from Wind Resource Data
Wind Data Source Eastern Wind Integration Data Set Model data generated for wind grid integration studies. Not real output, but predicted for actual locations. No gaps in data No QA needed Lat & Long provided
Capacity Factor 24 day 365 hr days y r = = # / 8 7 6 0 / h r yr hr yr The amount of energy generated divided by the amount which could be produced if the turbine were running at its full capacity all of the time. Typically considered over a year, but could be measured over any timeframe. Example: If a 2 MW (2000 kW) wind turbine generates 5,956,800 kWh of energy in a year, what would this project s capacity factor be? 5,956,800 2000 kW / kWh yr hr y = = = 0.34 34% C F 8760 / r
Wind Turbine Power Curves [kW] Alstom Eco 80/1670 Class II 1 33 94 197 346 538 771 1033 1288 1489 1607 1655 1668 1670 1663 1638 1596 1549 1499 1449 1401 1356 1314 Alstom Eco 80/2000 Class II 0 32 98 200 339 522 766 1054 1370 1668 1894 1981 2000 2000 2000 2000 1982 1936 1876 1824 1772 1712 1660 Vestas V126-3.3 MW IEC IIIA 20 162 395 694 1060 1714 2432 2999 3260 3300 3300 3300 3300 3300 3300 3300 3300 3300 3300 3300 3300 3300 3300 Alstom Eco 74/1670 Class II 0 32 98 185 301 460 671 938 1232 1495 1634 1669 1670 1670 1670 1670 1670 1670 1670 1670 1670 1670 1670 Siemens SWT-2.3- 113 70 223 409 722 1074 1570 2009 2191 2270 2298 2300 2300 2300 2300 2300 2300 2300 2300 2300 2300 2300 2300 2300 Siemens SWT-2.3- 93 0 98 210 376 608 914 1312 1784 2164 2284 2299 2300 2300 2300 2300 2300 2300 2300 2300 2300 2300 2300 2300 Siemens SWT-2.3- 82 VS 0 42 136 276 470 727 1043 1394 1738 2015 2183 2260 2288 2297 2299 2300 2300 2300 2300 2300 2300 2300 2300 Vestas V126 - 3.0 MW 14 179 416 712 1148 1713 2219 2566 2858 3000 3000 3000 3000 3000 3000 3000 3000 3000 3000 3000 0 0 0 Vestas V110-2.0 MW 23 140 314 549 900 1347 1775 1972 1999 2000 2000 2000 2000 2000 2000 2000 2000 2000 2000 2000 2000 2000 2000 Vestas V90-2.0 MW 0 97 220 392 616 927 1275 1622 1899 2000 2000 2000 2000 2000 2000 2000 2000 2000 2000 2000 2000 2000 2000 Wind Speed [m/s] GE 1.6- 100 0 47 180 449 745 1058 1371 1523 1585 1600 1600 1600 1600 1600 1600 1600 1600 1600 1600 1600 1600 1600 1600 3 4 5 6 7 8 9 10 11 12 13 14 15 16 17 18 19 20 21 22 23 24 25
Procedures for the Competition Choose a location and its accompanying data for this exercise Create a histogram Select a Power Curve Calculate the energy produced from the selected turbine at your site using the histogram and the power curve Calculate and record the Levelized cost of energy Calculate and record the capacity factor Iterate until you believe you have found the best turbine for your location. Compare results with the class and see who came up with the lowest LCOE and highest CF. Discuss!
Calculating Energy https://youtu.be/GVHc1zpLnXw Alstom Eco 80/1670 Class II 1 33 94 197 346 538 771 1033 1288 1489 1607 1655 1668 1670 1663 1638 1596 1549 1499 1449 1401 1356 1314 Alstom Eco 80/2000 Class II 0 32 98 200 339 522 766 1054 1370 1668 1894 1981 2000 2000 2000 2000 1982 1936 1876 1824 1772 1712 1660 Vestas V126-3.3 MW IEC IIIA 20 162 395 694 1060 1714 2432 2999 3260 3300 3300 3300 3300 3300 3300 3300 3300 3300 3300 3300 3300 3300 3300 Alstom Eco 74/1670 Class II 0 32 98 185 301 460 671 938 1232 1495 1634 1669 1670 1670 1670 1670 1670 1670 1670 1670 1670 1670 1670 Siemens SWT-2.3- 113 70 223 409 722 1074 1570 2009 2191 2270 2298 2300 2300 2300 2300 2300 2300 2300 2300 2300 2300 2300 2300 2300 Siemens SWT-2.3- 93 0 98 210 376 608 914 1312 1784 2164 2284 2299 2300 2300 2300 2300 2300 2300 2300 2300 2300 2300 2300 2300 Siemens SWT-2.3- 82 VS 0 42 136 276 470 727 1043 1394 1738 2015 2183 2260 2288 2297 2299 2300 2300 2300 2300 2300 2300 2300 2300 Vestas V126 - 3.0 MW 14 179 416 712 1148 1713 2219 2566 2858 3000 3000 3000 3000 3000 3000 3000 3000 3000 3000 3000 0 0 0 Vestas V110-2.0 MW 23 140 314 549 900 1347 1775 1972 1999 2000 2000 2000 2000 2000 2000 2000 2000 2000 2000 2000 2000 2000 2000 Vestas V90-2.0 MW 0 97 220 392 616 927 1275 1622 1899 2000 2000 2000 2000 2000 2000 2000 2000 2000 2000 2000 2000 2000 2000 Wind Speed [m/s] GE 1.6- 100 0 47 180 449 745 1058 1371 1523 1585 1600 1600 1600 1600 1600 1600 1600 1600 1600 1600 1600 1600 1600 1600 3 4 5 6 7 8 9 25 / m s = [ ] Energ y Power t me i at each velocit y = 0 / m s v 10 11 12 13 14 15 16 17 18 19 20 21 22 23 24 25
Levelized Cost of Energy TIC en rc en = + LCOE fcr en = energy, to be calculated from wind resource data and selected wind turbine power curve TIC = total installed cost for project (equation to be provided for educational purposes) fcr = fixed charge rate - an annualized presentation of the cost of financing a wind project rc = recurring charges. Typically provided per unit of energy, e.g. $/kWh. For instance, operation and maintenance costs.
LCOE Example Problem Under the following conditions for a wind turbine project, calculate the levelized cost of energy for this project: Total installed cost for the project is $30,000,000 Average amount of energy produced at the project site is 61,320,000 kWh/yr Fixed charge rate (fcr) = 0.09 Operation & Maintenance charges (recurring charges rc/en) = $0.01/kWh TIC LCOE en rc en = + fcr $30,000,000*0.09 61,320,000 LCOE= + = $0.01/ $0.054/ kWh kWh kWh
Competition We are supplying wind data for several locations. You will form teams and choose which data set you would like to work with. You will then characterize this wind resource with a histogram and calculate the energy production by applying a power curve. Several are provided to you. Cost data has also been provided. Your objective is to minimize the LCOE of your wind turbine installation by choosing an optimal turbine for your location. You will also calculate the resulting capacity factor of your design.
Levelized Cost of Energy TIC en rc en = + LCOE fcr : Assumptions fcr rc en = 0.11 = $0.015/ kWh en = energy, to be calculated from wind resource data TIC = total installed cost, to be calculated from the following equation which is a function of the turbine size: ??? = $150 ????? ???? ?2+ $250 ????? ????? ?? + $1,500,000 (??????? ?? ??????)