Insights into Wind Power Efficiency and Practical Applications
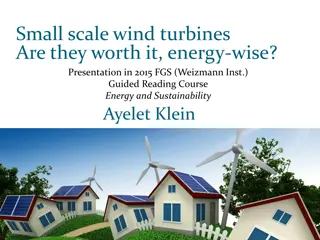
Exploring the practical and theoretical aspects of wind power, including the Betz Factor and Clipper Wind's actual power curve. Understanding how wind speed affects power output and the limitations of wind turbines in harnessing energy effectively.

Download Presentation

Please find below an Image/Link to download the presentation.
The content on the website is provided AS IS for your information and personal use only. It may not be sold, licensed, or shared on other websites without obtaining consent from the author. Download presentation by click this link. If you encounter any issues during the download, it is possible that the publisher has removed the file from their server.
E N D
Presentation Transcript
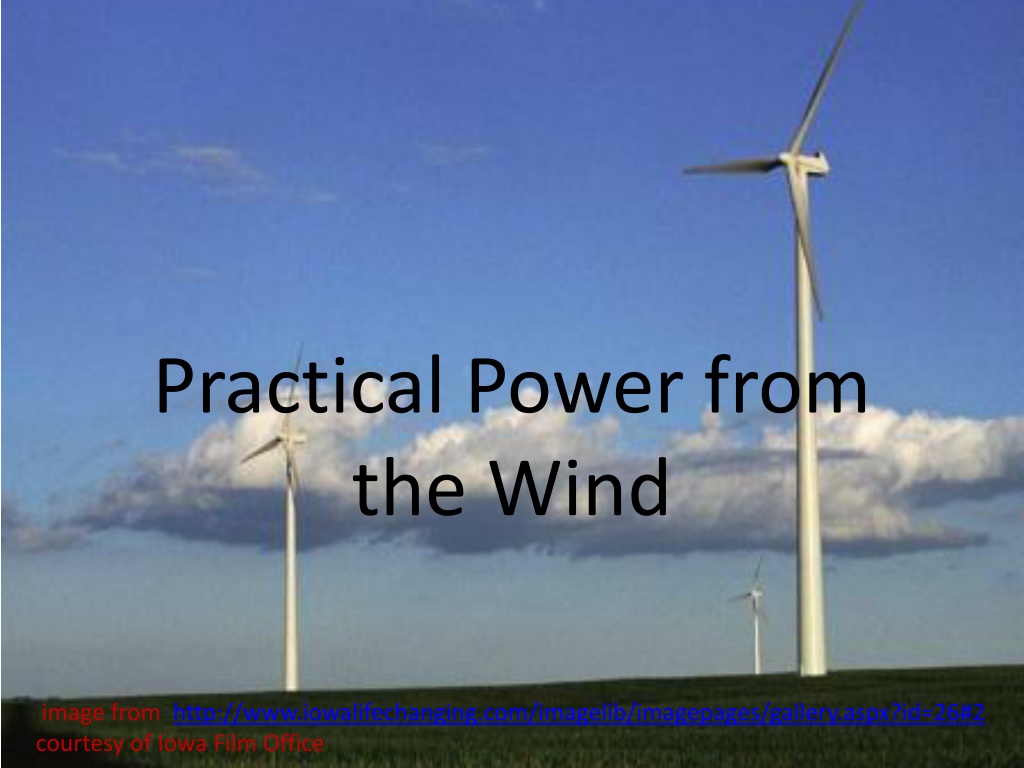
Practical Power from the Wind image from http://www.iowalifechanging.com/imagelib/imagepages/gallery.aspx?id=26#2 courtesy of Iowa Film Office
Theoretical Wind Power Energy = Power * time Power = Energy/time wind energy = Atv3 wind power = Av3
Betz Factor The ratio of practical power to the power in the wind is called the Betz Factor Betz Factor = 16/27 = 0.593
Practical Wind Power wind power = cp Av3 where cp = 0.593 for wind turbines using lift (not drag) Betz Factor
Clipper Wind: Actual Power Curve Power curve from http://www.clipperwind.com/pdf/liberty_brochure.pdf
Clipper Wind: Actual Power Curve Any power generated by the turbine will be significantly less than cp Av3. This is a result of losses in converting mechanical to electrical power, friction, etc. Power curve from http://www.clipperwind.com/pdf/liberty_brochure.pdf
Clipper Wind: Actual Power Curve power = cp Av3 For example at v = 10m/s, theoretical power = (0.593)* (1.2 kg/m3)*(7854m2)* (10m/s)3 = 2.79 MW At 10 m/s, Actual Power 1800 kW = 1.8 MW Efficiency = 64% Power curve from http://www.clipperwind.com/pdf/liberty_brochure.pdf
Clipper Wind: Actual Power Curve At 5 m/s, Power 225 kW At 10 m/s, Power 1800 kW This is an 8x increase as expected by wind power v3 Power curve from http://www.clipperwind.com/pdf/liberty_brochure.pdf
Clipper Wind: Actual Power Curve After 10 m/s, wind power v3 will not accurately predict the power. This is due to the generator and other mechanical components of the turbine unable to increase power output proportional to the wind velocity Power curve from http://www.clipperwind.com/pdf/liberty_brochure.pdf
Clipper Wind: Actual Power Curve The cut-out wind velocity of this turbine is 25m/s The constant output of power between 13m/s and 25 m/s is achieved through pitch control Power curve from http://www.clipperwind.com/pdf/liberty_brochure.pdf
Clipper Wind - Pitch Control Pitch control allows the blade of each turbine to be oriented in a manner to maximize wind power prior to 2.5MW on the Liberty 2.5 MW Wind Turbine. Once the output reaches 2.5 MW, pitch control will be used to limit the power from the wind in order to maintain a constant 2.5MW output from the 4 generators. Power curve from http://www.clipperwind.com/pdf/liberty_brochure.pdf