Overview of Demographic and Government Characteristics in Iron County
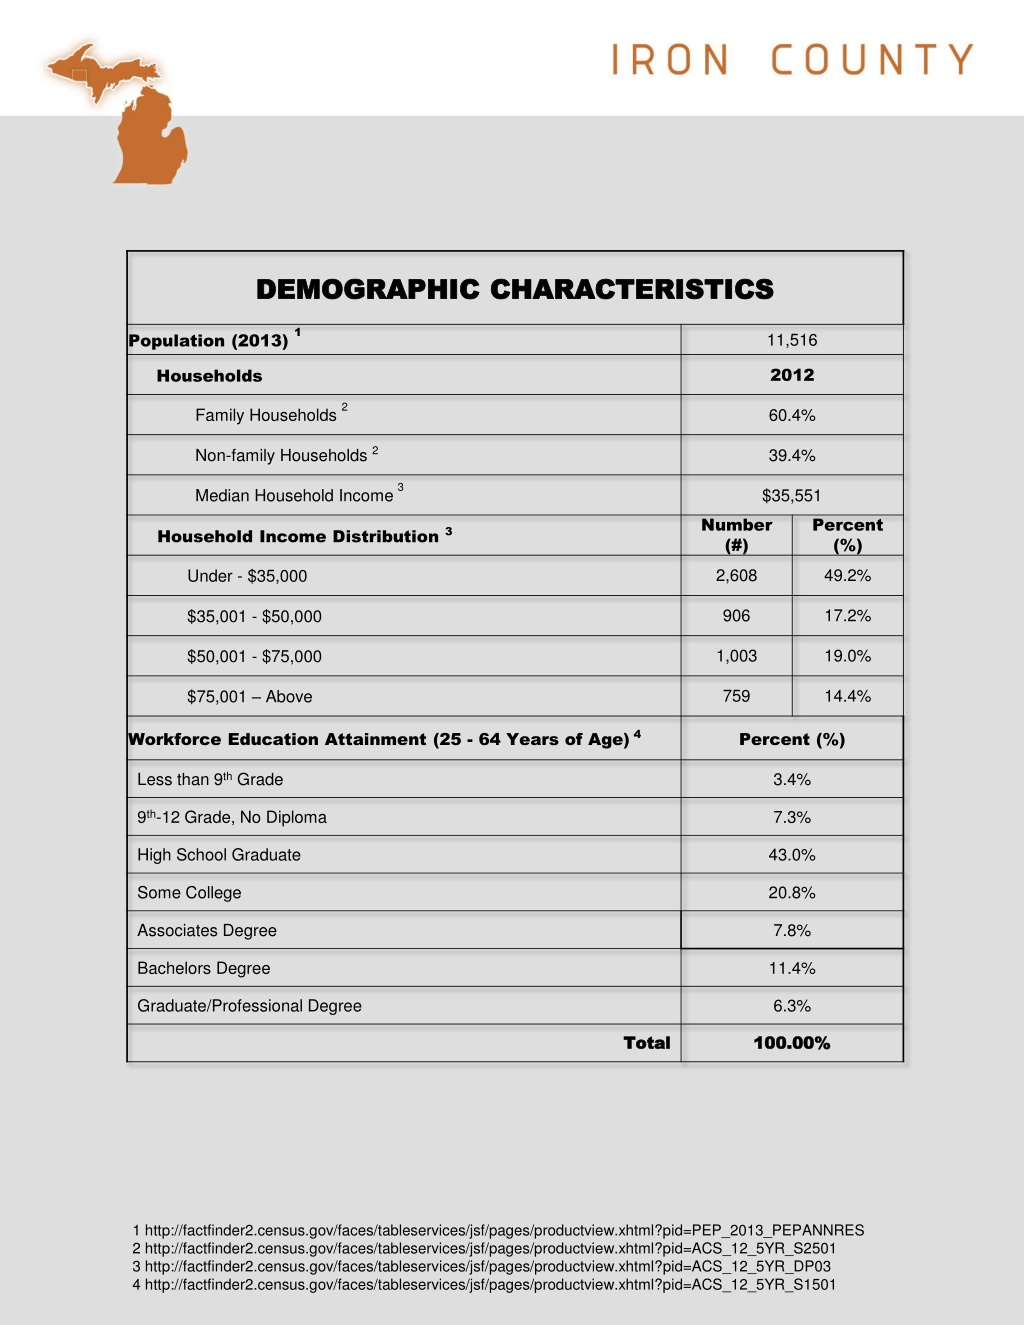
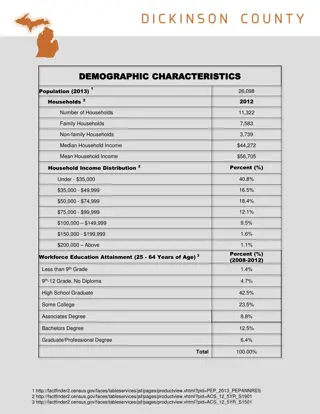
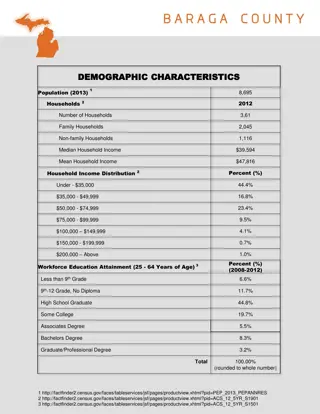
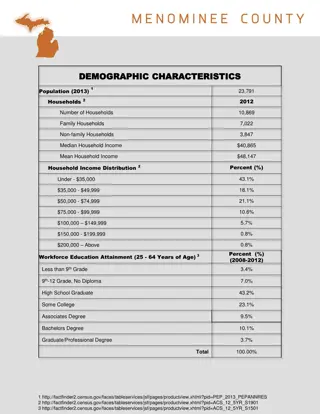
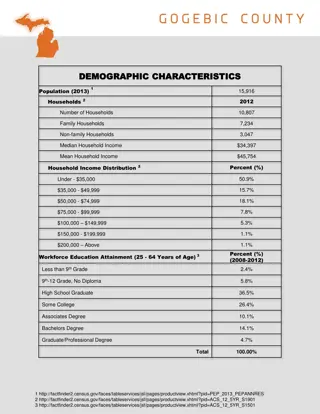
Iron County, with a population of 11,516 in 2013, has a median household income of $35,551. The workforce education attainment shows a diverse range of educational levels. The city of Iron River, along with Crystal Falls and Caspian, have distinct city governments with different structures. Additionally, the county government in Iron County operates with a manager-commission system. The state government representation includes various elected officials serving the area at the upper and lower house levels.

Download Presentation

Please find below an Image/Link to download the presentation.
The content on the website is provided AS IS for your information and personal use only. It may not be sold, licensed, or shared on other websites without obtaining consent from the author. Download presentation by click this link. If you encounter any issues during the download, it is possible that the publisher has removed the file from their server.
E N D
Presentation Transcript
DEMOGRAPHIC CHARACTERISTICS DEMOGRAPHIC CHARACTERISTICS 1 Population (2013) 11,516 2012 Households 2 Family Households 60.4% Non-family Households 2 39.4% 3 Median Household Income $35,551 Number (#) Percent (%) Household Income Distribution3 2,608 49.2% Under - $35,000 906 17.2% $35,001 - $50,000 1,003 19.0% $50,001 - $75,000 759 14.4% $75,001 Above Workforce Education Attainment (25 - 64 Years of Age) 4 Percent (%) Less than 9th Grade 3.4% 9th-12 Grade, No Diploma 7.3% High School Graduate 43.0% Some College 20.8% Associates Degree 7.8% Bachelors Degree 11.4% Graduate/Professional Degree 6.3% Total Total 100.00% 100.00% 1 http://factfinder2.census.gov/faces/tableservices/jsf/pages/productview.xhtml?pid=PEP_2013_PEPANNRES 2 http://factfinder2.census.gov/faces/tableservices/jsf/pages/productview.xhtml?pid=ACS_12_5YR_S2501 3 http://factfinder2.census.gov/faces/tableservices/jsf/pages/productview.xhtml?pid=ACS_12_5YR_DP03 4 http://factfinder2.census.gov/faces/tableservices/jsf/pages/productview.xhtml?pid=ACS_12_5YR_S1501
GOVERNMENT GOVERNMENT City City Government Government City of Iron River Form (Structure) Mayor 1 City Manager (Yes or No) 2 City Clerk 2 Assessor 2 Treasurer 2 Manager - Council Terry Tarsi Yes - Perry Franoi Rachel Andreski Thomas J. Novascone Suzanne A. Johnson Terry Tarsi Daniel Baumgartner Edward Marcell Jere Fritsche Rick Commenator City of Iron River City Council Members 1 City of Crystal Falls 3 Form (Structure) Manager - Council Mayor Janet Henrickson City Manager (Yes or No) Yes Dorothea Olson Clerk/ Treasurer Tara Peltoma Assessor Patti Roell Janet Hendrickson Jack Bicigo Adam Schiavo Patrick Sommers David Sherby City of Crystal Falls City Council Members 3 City of Caspian 4 Form (Structure) Manager - Council Mayor Anthony Dallaville City Manager (Yes or No) Yes John Stokoski Treasurer Assessor Sandra Sundquist Patti Roell Anthony Dallaville Jody Menghini Colleen Smetak Gary Sabol Mark Stauber City of Caspian City Council Members 4 1 http://www.ironriver.org/government/council.htm 2 http://www.ironriver.org/government/administration.htm 3 http://www.crystalfalls.org/government.htm 4 http://www.caspiancity.org/government.htm
GOVERNMENT GOVERNMENT County County Government Government Form (Structure) Manager - Commission # of Board Members 5 County Administrator (Yes or No) 1 Yes Sue K. Clisch Clerk 2 Diane Hilberg Equalization 3 Joan Mussatto Register of Deeds 4 Joetta Greig Treasurer 5 Melanie Camps James Brennan Chair Ray Coates Timothy Aho Patti Peretto Carl Lind Iron County Commissioners 1 1 http://ironmi.org/contact/39-2/ 2 http://ironmi.org/departments/clerk/ 3 http://ironmi.org/departments/equalization/ 4 http://ironmi.org/departments/register-of-deeds/ 5 http://ironmi.org/departments/treasurer/
GOVERNMENT GOVERNMENT 1 State Government Form (Structure) # of Elected Officials Upper House Representing Area Total Statewide Upper House Lower House Representing Area Total Statewide Lower House State Representative Serving the Area 2 Legislative House District 110 Represents Counties: Baraga, Gogebic, Houghton, Iron, Keweenaw, Marquette, Ontonagon State Senator Serving the Area 3 Legislative Senate District 38 Represents Counties: Alger, Baraga, Delta, Dickinson, Gogebic, Houghton, Iron, Keweenaw, Luce, Marquette, Menominee, Ontonagon, Schoolcraft Governor Name Years in Office Current Term Expiration Date Allowed to Run for Another Term (Yes or No) Next Election Date US Government Representation Congressional Districts Listed by District # in the Service Area (By District) Bicameral 148 1 38 2 110 Scott Dianda Tom Casperson 4 Rick Snyder 2 Jan. 1, 2015 Yes Nov. 4, 2014 5 US Congresspersons Serving the Area Name Years in Office Current Term Expiration Date Next Election Date US Senators Serving Area Name Years in Office Current Term Expiration Date Next Election Date Name Years in Office Current Term Expiration Date Next Election Date Dan Benishek 2 Jan. 3, 2015 Nov. 4, 2014 Carl Levin 34 Jan. 3, 2015 Nov. 4, 2014 Debbie Stabenow 13 Jan. 3, 2018 Nov. 4, 2017 1 http://www.michigan.gov/som/0,4669,7-192-29701_29704---,00.html 2 http://110.housedems.com/ 3 http://www.senatortomcasperson.com/ 4 http://www.michigan.gov/snyder 5 http://www.contactingthecongress.org
QUALITY OF LIFE QUALITY OF LIFE 2012 2012 Housing 1 Number of Housing Units (2013) 9,206 Occupied Housing Units 2 5,276 Vacant Housing Units 2 3,928 Homeowner Vacancy Rate 2 3.6% 2 Median Value $75,100 Number (#) Percent (%) Number of Single Family Homes For Sale by Price 2 Less than $50,000 1,235 27.6% $50,000 - $99,000 1,611 36.0% $100,000 $149,999 600 13.4% $150,000 - $199,999 467 10.4% $200,000 - $299,999 330 7.4% $300,000 - $499,999 158 3.5% $500,000 - $999,999 60 1.3% $1,000,000 or more 8 .2% 2 Rentals Average Monthly Gross Rent Paid (Median) $482 Rental Vacancy % 13.3% 1 http://factfinder2.census.gov/faces/tableservices/jsf/pages/productview.xhtml?pid=PEP_2013_PEPANNHU 2 http://factfinder2.census.gov/faces/tableservices/jsf/pages/productview.xhtml?pid=ACS_12_5YR_DP04
QUALITY OF QUALITY OF LIFE LIFE 1 Culture Top Annual Event Annual Dates Heritage Day Cultural/ Historical Event May U.P Championship Rodeo Rodeo July Annual Rodeo Concert Live Music Event July Iron County Museum Fine Arts Show Art Show August Iron County Fair County Fair/ Festival August CULTURAL PLACES # Of Cultural Places & Amenities Iron County Historical Museum 2 Amasa Museum 3 Harbor House Museum 4 1 http://ironcountylodging.com/events/action~month/exact_date~1406869200/ 2 http://www.ironcountyhistoricalmuseum.org/ 3 https://www.facebook.com/pages/Amasa-Museum/111317465609483?sk=info 4 http://www.harbourhousemuseum.org/
LABOR FORCE CHARACTERISTICS Total Number Employed Non-Agricultural Employment Reported by Place of Work 1 2013 28 305 398 20 51 651 488 628 241 1,188 887 4,885 2012 24 297 401 18 51 633 463 622 238 1,156 879 4,782 Mining Construction Manufacturing Public Utilities Wholesale Trade Retail Trade Finance, Insurance & Real Estate Healthcare Agriculture & Forestry Service* Government Total 1 Resident Employment Reported by Group Occupation Latest Year Available Latest Year Available 1,169 1,033 1,206 80 1,447 346 Professional Sales Service Farming & Forestry Transportation & Public Utilities Laborers/ Handlers Percent % 3 Commute To Work Time (2012) Labor Participation Rate Percent (2012) 2 Less than 10 Minutes 34.7% Male 50.3% 10 - 19 Minutes 32.8% Female 49.7% 20 29 Minutes 12.3% 30 Minutes or more 20.2% Total 100% Median Travel Time 18.2 minutes *Services includes Professional, Technical, Scientific, Administrative, Support, Waste and Remediation, Educational, Food and Accommodation, and other services 1 http://www.economicmodeling.com/data/usa-data/ 2 http://factfinder2.census.gov/faces/tableservices/jsf/pages/productview.xhtml?pid=ACS_12_5YR_S2403 3 http://factfinder2.census.gov/faces/tableservices/jsf/pages/productview.xhtml?pid=ACS_12_5YR_S0801
RESEARCH BASE RESEARCH BASE Location Affiliation (e.g. Corporate, Non-Profit, University, Government, etc.) Name of Center City County Michigan State University Extension 1 Crystal Falls Iron Michigan State University 1 http://msue.anr.msu.edu/county/info/iron
1 1 TAXATION TAXATION Corporate Income Tax/Franchise Tax State Rate (range) 6% Personal Income Tax State Rate (Range) 4.33% Sales/Use Tax Rate State 6% Sales Tax Rate by Utility: Electric Power 4% Natural Gas 4% Fuel Oil .19/gal TOTAL TOTAL PROPERTY TAX RATES PROPERTY TAX RATES TOTAL MILLAGE (2013) 2 Principal Residence or Ag Exemption 30.4278 Non Industrial Personal Commercial Personal Iron County Townships Homestead Bates 48.2105 24.4278 36.2105 Crystal Falls 28.4524 46.1398 22.4524 34.1398 Hematite 28.9524 46.6398 22.9524 34.6398 Iron River 26.4470 44.2297 20.4470 32.2297 Mansfield 26.9374 44.6248 20.9374 32.6248 Mastodon 26.9524 44.6398 20.9524 32.6398 Village of Alpha 44.8528 62.5402 38.8528 50.5402 Stambaugh 27.4470 45.2297 21.4470 33.2297 Caspian City 44.2347 62.0174 38.2347 50.0174 Crystal Falls City 44.2887 61.9761 38.2887 49.9761 Gaastra City 42.1470 59.9297 36.1470 47.9297 Iron River City 43.7175 61.5002 37.7175 49.5002 1 http://www.michiganbusiness.org/site-selection/commercial-real-estate-database/ 2 http://www.michigan.gov/documents/taxes/2013_Total_Rates_450527_7.pdf
ENVIRONMENTAL ENVIRONMENTAL 1 Area in Attainment for Federal Air Pollution Regulations Yes No Ozone Carbon Monoxide Particular Matter Lead Sulfur Dioxide Nitrogen Dioxide State Instituted a One-Stop Air & Water Quality Permitting System Average Permit Approval Time From Date of Completed Routine Application Air Permit Water Permit Hazardous Waste Permit X X X X X X X Average Time 1 160 days 180 days 140 days Contact Information Name of Agency Address Phone Michigan Department of Environmental Quality Dickinson-Iron Health Department 1504 W. Washington, Marquette, MI 49855 818 Pyle Drive, Kingsford, MI 49802 1 Air Quality 906-228-4853 2,3 Water Quality 906-774-1868 Projected Projected Years of Years of Remaining Remaining Capacity Capacity Capacity Capacity Remaining Remaining (Cubic Yards) (Cubic Yards) Name of Agency Name of Agency Address Address Phone Phone Landfill Landfill Contact Contact Information Information Wood Island Waste Management, Inc. E10081 State Hwy M28 Wetmore, MI 49895 5 11877 State Hwy M38 Ontonagon, MI 49953 4 4 362,047 5 years 906-387-2646 6 K & W Landfill 2,042,396 20 years 906-883-3504 1 http://www.michigan.gov/deq 2 http://www.didhd.org/ 3 http://www.michigan.gov/documents/deq/deq-ess-recycle-contact-iron_215398_7.pdf 4 http://www.michigan.gov/documents/deq/DEQ-OWMRP-SWS-SolidWasteAnnualReportFY2013_447054_7.pdf 5 http://www.yellowbook.com/profile/wood-island-waste-management-inc_1631148241.html 6 http://www.yellowpages.com/ontonagon-mi/mip/k-w-landfill-inc-452933282