Demographic Analysis and Changes in M250 Module Engagement

The M250 module underwent significant changes in 2021, introducing a new curriculum with practical activities and automated feedback features. The demographic analysis revealed a majority of students aged 25-34, with completion rates varying across different demographic groups. Overall, students found the level of content in M250 to be improved compared to their expectations for a Level 2 Java module.

Download Presentation

Please find below an Image/Link to download the presentation.
The content on the website is provided AS IS for your information and personal use only. It may not be sold, licensed, or shared on other websites without obtaining consent from the author. Download presentation by click this link. If you encounter any issues during the download, it is possible that the publisher has removed the file from their server.
E N D
Presentation Transcript
M250 engagement Demographic analysis Anton Dil Computing and Communications 19thApril 2023
Background New M250 from 2021J Object-oriented Java programming
M250 Changes How 2021J materials differed Brand new module, with unchanged learning outcomes Dropped old in-house materials Bought-in textbook ( Objects First with Java , Barnes and Kolling) More practical, perhaps harder Added some extension content for better students OU Chapter companions : 70 embedded practical activities with automated feedback Unlimited automated feedback on TMA solutions before submission Lots of forum discussion relating to automated feedback Exam now online Well-received by tutors. SEAM feedback generally improved Navigating the material is harder than with old in-house materials. Reg25 N = 1395 Exam N = 1060 3
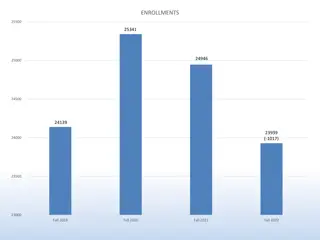
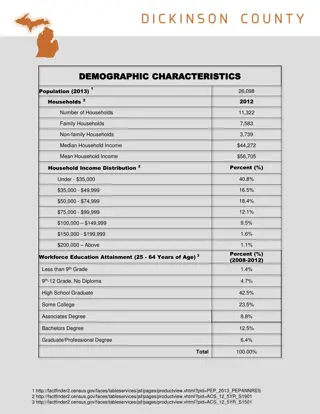
Age breakdown Mostly 25-34 Percentages in age bands 19.5% < 25 46.7% 25-34 23.8% 35-44 8.5% 45-54 1.1% 55-64 0.3% 65+ (3 students) Different data set to module profile tool, included demographics. 4
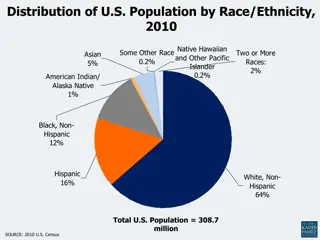
M250 2021J Demographics and dropout Students drop out rather than fail Demographic groups Completion rates (module profile tool) Overall completion 69% 86% White, 14% other groups 85% mid to higher SES 80% not disabled 77% male, 23% female 66% aged under 35 63% Q62 Computing and IT 15% Q67 Computing and IT with a second subject 22% other qualifications Asian -3% Black -11% Mixed -1% Other +13% Low SES (-1% vs mid to higher SES) Disabled (-15% vs non-disabled) Female (-6% vs male) Age 35+ (-0.7% vs < 35) Q67 (-2% vs Q62) For completing students, credit received rates are similar, notably except for Black students and Low SES. 5
M250 level expectations Comfort improved How did you find the level of M250 content, compared to your expectations for a Level 2 Java module? 2020J N=227 2021J + 16% in about right N=186 6
Comfort with level of M250 Measuring students who made it to the end, probably Mostly, students responding to our comfort survey were not affected by demographic group No significant differences for comfort Significant differences for comfort Combining comfort levels 1 - 3 ( about right or finding it easy) versus 4 + 5 ( too high or much too high ) Female vs male Ethnicity Disabled vs non-disabled Age 35+ vs <35 Higher Index of Multiple Deprivation less comfortable IMD quintiles 1 & 2 versus 3-5, Chi-Square = 4.405; p = .036 Q67 vs other qualifications (next slide) 7
Q62 versus Q67 or Other qualification Specialists versus non-specialists comfort levels Q62 centred on about right Q67 centred on a bit too high Remember Q67 dropout +2% Q62 Computing and IT (67%) Q67 with another subject (17%) Other (16%) Other Quals not sig. different comfort distribution to Q62 Q67 is taken by 26% of females vs 11% of males 30% of Black vs 14% of White Asian lowest on Q67 (5%) Comparing expectation in Too high + Much too high Q67 > non Q67 p < .001 8
Engagement Use of 70 formative activities 02
M250 2021J Formative Engagement 70 embedded activities online, with automated feedback Formative activities were made more visible. Who does them? Most students at least visit most activities. Some have dropped out by these end of module stats. Mostly around when they are scheduled, with extra peaks before related assignments Engagement is correlated with scores on TMAs and Exam (Spearman s rho range from 0.283 0.348 from TMA01 to TMA03) Not as highly correlated as TMAs and Exam with each other (0.614 0.760) 10
M250 2021J Formative Engagement 70 embedded activities online, with automated feedback Age Mean and median engagement increases with age Here 65+ (N=3 group) is merged with 55-64. Gender Females more engaged (median +7) p = .024 Female lower IQR (interquartile range) 11
M250 2021J Formative Engagement 70 embedded activities online, with automated feedback Ethnicity Black students lower median (N=24 group), but not statistically sig. Black students less likely to have done > half of the activities (p = .028) Mixed, Other more engaged Includes students who dropped out. Qualification Q62 more engaged (not sig.) Q62 median 52 Q67 median 47 Other median 47 12
TMA engagement Interactive feedback on summative TMA questions 03
M250 2021J Summative TMA Interactions TMA testbeds also provided this formative feedback, unlimited attempts Students visit testbeds mostly around the time a TMA is due 14
Three kinds of feedback 1. Compilation errors - hand-tuned, a bit of guesswork. 15
Three kinds of feedback 2. Specification comprehensive structural feedback, leading to unit testing. Compilation and specification feedback were produced in a previous eSTEeM project 16
Three kinds of feedback 3. Functional, testing the student s code 17
M250 2021J Summative TMA Interactions Older, female students higher median steps on testbeds Many uses, with a long tail. High skew. Log-scale interactions over all TMAs per student Mean total steps 193, median 136 but > 1000 interactions for some students. T-tests for different mean total number of steps Age 35+ > younger p = .005 Level high > level OK p = .030 female > male p = .081 Unclear from this whether fewer interactions means more confident or more stuck. Some bring nearly complete work to testbed, others work in testbed. 18
M250 2021J TMA Interactions Age differences in testbed use Log-scale interactions over all TMAs per student by age Age 35+ median > younger p = .024 Older median 145 Younger median 128 Older max 6477 Younger max 1633 19
M250 2021J TMA Interactions Gender difference in testbed use Log-scale interactions over all TMAs per student by gender Gender Female median > male p = .052 Male and female distributions look similar, but standard deviation for females is much larger 514 vs 184 for males. Female median 151 Male median 130 Female max 6477 Male max 2396 20
M250 2021J TMA Interactions Below median interactions versus scores on TMAs For all TMAs, below median interactions group has sig lower mean (but not median) TMA scores Example for TMA03 mean score Higher steps mean 84.5% > Lower steps mean 78.9% (p < .001) Greater IQR and lower Q0 for students with below median steps on TMA03. Number of steps correlated positively with TMA score (here .313) 21
Compilation errors Whose TMA code failed to compile more often? 04
M250 2021J TMA01 Interactions How many clicks on TMA01? TMA01 has the highest engagement (withdrawals affect TMA02, 03) For TMA01: 1298 Personal Identifiers 69570 steps (some not compilation, recorded as null input) 65261 compilations 40099 compilations OK 25162 errors or warnings 65 error codes 38.6% of the time a compilation error. Dropping to 26.2% for TMA02 and 20.0% for TMA03. Greater variety of errors for later TMAs. (TMA02 PIs 1060, TMA03 943) Typical errors, but some related to copying and pasting from an IDE. 23
M250 2021J TMA01 Interactions Ratio of OK compilations, means by demographics Ratio of OK compilations / number of steps TMA01 comparison T-test for different means of OK compilation ratio Mean = .72, std dev. = .256 (N = 1251) Female < Male t = -4.881 p < .001 .65 vs .74 Low SES < Higher t = 2.399 p = .017 .68, vs .73 Disabled < Not t = 2.313 p = .021 .69, vs .73 24
M250 2021J TMA01 Interactions Median differences in OK Ratio, and proportions below median Comparing ratio of OK compilations by gender TMA01 comparison Tests for different median OK compilation ratio. Overall median is .793 No sig. for Qual, ethnicity, older, Low SES Female < Male p < .001 .70 vs .82 Disabled < Not p = .042 .76 vs .80 Below median OK ratio => lower scores on the TMAs (11% difference in medians, 13% in means) and Exams (median 68% vs 85%) p < .001 25
Summary New M250 well-received, better comfort levels Q67 (non-specialists), lower SES less comfortable Formative activity use Female, older, specialists (Q62) more engaged Black students less likely to have done most of the activities TMA testbed use high, positively skewed, with a long tail Female, older students higher median numbers of steps (female bordering on 95% confidence) Higher steps => higher mean scores (suggests improving their code) Promotes forum discussion OK Compilation ratio OK compilation ratio improves from TMA01 to TMA03, but weaker students have dropped out Female, disabled, lower ratio of OK compilations Below median OK ratio strongly associated with dropout, lower TMA scores, not taking exam (-12%), or lower exam scores Completing students mostly pass in similar proportions, except for Black and Low SES students. 26
Project members Sharon Dawes, Richard Walker, Matthew Nelson, Lindsey Court Thank you Anton Dil anton.dil@open.ac.uk