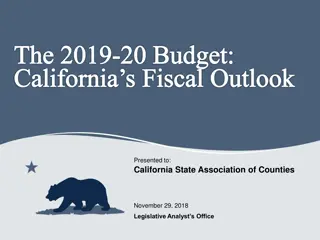
Demographic Trends and Future Projections: A Comprehensive Analysis
Explore the demographic transformation from past to future, including population growth rates, urbanization trends, and county-level projections in Utah. Learn about the impact of migration on population change and key factors influencing demographic shifts. Data sources include the Bureau of the Census and the Kem C. Gardner Policy Institute.

Download Presentation

Please find below an Image/Link to download the presentation.
The content on the website is provided AS IS for your information and personal use only. It may not be sold, licensed, or shared on other websites without obtaining consent from the author. Download presentation by click this link. If you encounter any issues during the download, it is possible that the publisher has removed the file from their server.
E N D
Presentation Transcript
Our Demographic Transformation: A View Into the Future November 2018
18 Years 17 Years 20 Years 29 Years 1966 2050 1995 2015 2032
Population Growth by Decade: Utah and U.S. Average Annual Rate of Growth 3.5% 3.3% 3.0% 3.0% 2.6% 2.6% 2.5% 2.3% 2.2% 1.9% 1.9% 1.9% 2.0% 1.7% 1.7% 1.7% 1.6% 1.5% 1.4% 1.4% 1.4% 1.5% 1.3% 1.2% 1.2% 1.2% 1.1% 1.0% 0.9% 0.9% 1.0% 0.8% 0.7% 0.7% 0.7% 0.5% 0.4% 0.4% 0.5% 0.0% 1900s 1910s 1920s 1930s 1940s 1950s 1960s 1970s 1980s 1990s 2000s 2010s 2020s 2030s 2040s 2050s US UT Sources: Bureau of the Census: Decennial Census and 2017 National Population Projections; Kem C. Gardner Policy Institute: 2017 Baseline Projections
100% 90% 80% 70% Percent of the Population 60% 50% 40% 30% 20% 10% 0% 1850 1860 1870 1880 1890 1900 1910 1920 1930 1940 1950 1960 1970 1980 1990 2000 2010
Total Population by County: 2065 Source: Kem C. Gardner Policy Institute 2015-2065 State and County Projections
Absolute Population Change by County: 2015-2065 Source: Kem C. Gardner Policy Institute 2015-2065 State and County Projections
Percent Population Change by County: 2015-2065 Source: Kem C. Gardner Policy Institute 2015-2065 State and County Projections
Utah Population Change 1990-2010 Net Foreign Born, 45% Migration, 35% Native Born, 55% Natural Increase , 65% Sources: Bureau of the Census (decennial Censuses and Kem C. Gardner Policy Institute Calculations.
Utah Foreign Born Population, Recent Arrivals by Region of Birth Latin America 2.7% 2000 Census 10.9% 16.5% 64.9% 2.9% (entered 1990 to March 2000) 2.0% 2.7% 2007-2011 ACS (entered after 2000) 7.4% 20.2% 62.9% 2.2% 4.6% Asia 3.1% 2012-2016 ACS (entered after 2010) 9.5% 44.5% 34.3% 3.3% 5.3% 0% 10% 20% 30% 40% 50% 60% 70% 80% 90% 100% Europe Asia Africa Oceania Latin America Northern America . Sources: U.S. Census Bureau (2000) and American Community Survey 5-Year Estimates; Kem C. Gardner Policy Institute Calculations. Note: for 2000, entered 1990 to March 2000; for 2007-20122, entered 2000 or later; for 2012-2016, entered 2010 or later
Utahs Foreign Born Population: 2015 and 2017 Northern America 3.3% Africa 3.4% Northern America 3.6% Oceania 3.4% Africa 4.0% Oceania 2.8% Europe 9.3% Europe 10.3% Asia 20.0% Latin America 57.5% Latin America 60.5% Asia 21.8% 2015 2017 Source: U.S. Census Bureau, 2015 and 2016 American Community Survey 1-Year Estimates: C05006.
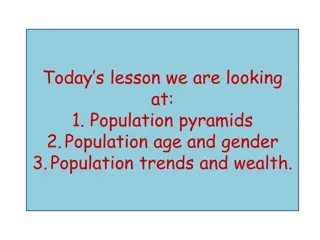
Utah Population Pyramid: 1960, 2015, & 2065 Note: The top age group for 1960 is 85+ Sources: U.S. Census Bureau, DemographyUTAH Population Committee, Kem C. Gardner Policy Institute State Projections
U.S. Dependency Ratios: 1970-2060 Aging Baby Boomer Drive Increase in Total 100 65+ is 1/5 90 79.0 76.1 80 73.3 72.8 72.1 65.1 70 17.7 64.2 61.6 61.6 58.9 60 18.6 41.2 37.5 35.5 38.1 20.1 20.3 27.7 50 20.7 40 61.3 30 46.5 41.5 41.3 20 38.2 36.7 36.5 35.8 34.9 34.8 10 0 1970 1980 1990 2000 2010 2020 2030 2040 2050 2060 Youth Retirement Age Source: Kem C. Gardner Policy Institute analysis of U.S. Census Bureau Decennial Census and Population Division estimates and 2017 projections. Note: Dependency Ratios are computed as the number of nonworking age persons per 100 working age (18-64 year old) persons in the population. Youth are less than 18 years old and retirement age is 65 years and older.
Utah Dependency Ratios Youth Dependency Ratios Decline and Stabilize 65+ is 1/5 100 89.9 90 82.3 80.0 78.3 13.9 76.1 80 71.9 70.3 69.9 15.8 68.6 68.2 13.5 70 14.4 35.1 15.2 60 31.7 20.0 27.0 24.7 50 40 76.0 66.5 66.4 30 54.3 53.0 49.9 45.6 44.9 44.4 43.3 20 10 0 1970 1980 1990 2000 2010 2020 2030 2040 2050 2060 Youth Retirement Age Source: Kem C. Gardner Policy Institute analysis of U.S. Census Bureau Decennial Census data and Kem C. Gardner Policy Institute Note: Dependency Ratios are computed as the number of nonworking age persons per 100 working age (18-64 year old) persons in the population. Youth are less than 18 years old and retirement age is 65 years and older.
Utah: Trend Toward Nation Total Fertility Rates 5.0 4.30 4.5 4.0 3.60 3.5 3.0 2.5 2.12 1.77 2.0 1.5 1.0 0.5 0.0 Utah U.S. 1960 2017
Utah: Trend Toward Nation Household Size 6.0 5.27 5.17 5.0 4.0 3.13 3.0 2.65 2.0 1.0 0.0 Utah U.S. 1960 2017
Utah: Trend Toward Nation Median Age 45.0 38.1 40.0 35.0 31.0 28.1 30.0 23.1 25.0 20.0 15.0 10.0 5.0 0.0 Utah U.S. 1970 2017
Utah: Trend Toward Nation Minority Share 45% 39.4% 40% 35% 30% 25% 21.7% 20% 15% 11.4% 10% 5% 1.9% 0% Utah U.S. 1960 2017
Utah: Trend Toward Nation Female Age at First Marriage 28.1 24.8
Utah: Trend Toward Nation Share of Households: Opposite Sex Married Couple with Children 60% 48% 50% 40% 40% 30% 30% 19% 20% 10% 0% Utah U.S. 1970 2017
Minority Share of Population Change: 2010 to 2017 Gray: Overall population decline Red: non-Hispanic white population decline, minority population increase Alaska Hawaii: 97.4% Sources: U.S. Census Bureau, Population Division
Utah Population Growth by Race and Ethnicity: 2016 to 2017 NH American Indian or Alaska Native 2% NH Black 7% NH Asian 15% NH Native Hawaiian or Pacific Islander 4% Hispanic 58% Minority 41% Non- Hispanic White 59% NH Two or More Races 14% Note: NH Non-Hispanic Sources: U.S. Census Bureau, Population Division
U.S. Population Growth by Race and Ethnicity: 2016 to 2017 NH American Indian or Alaska Native 0.8% NH Black 16.6% Non-Hispanic White 2.9% Hispanic 51.4% NH Asian 22.7% Minority 97.1% NH Native Hawaiian or Pacific Islander 0.5% NH Two or More Races 8.1% Note: NH Non-Hispanic Sources: U.S. Census Bureau, Population Division
Racial and Ethnic Composition of U.S. Youth Asian 5.2% Asian 8.1% All Others 7.2% All Others 13.0% Non-Hispanic White 51.1% Black 15.1% Non-Hispanic White 36.5% Black 16.0% Hispanic 24.9% Hispanic 32.0% 2060 2016 Sources: U.S. Census Bureau, 2017 National Projections
2015: Millennials Surpass Baby Boomers 5,000,000 United States 4,500,000 4,000,000 3,500,000 3,000,000 2,500,000 2,000,000 1,500,000 Greatest and Lost Generations (before 1930) 4.6 million 1,000,000 Generation X (1965-1981) 69.8 million Baby Boomers (1946-1964) 74.9 million Silent Generation (1930-1945) 26.3 million Generation Z (after 2000) 60.1 million Millennials (1982-2000) 82.8 million 500,000 0 0 2 4 6 8 10 12 14 16 18 20 22 24 26 28 30 32 34 36 38 40 42 44 46 48 50 52 54 56 58 60 62 64 66 68 70 72 74 76 78 80 82 84 86 88 90 92 94 96 98 100+ Source: U.S. Census Bureau, Population Division
2015: Millennials Surpass Baby Boomers 60,000 Utah 50,000 40,000 30,000 Greatest and Lost Generations (before 1930) 35,708 20,000 10,000 Generation X (1965-1981) 629,214 Baby Boomers (1946-1964) 514,533 Generation Z (after 2000) 767,523 Silent Generation (1930-1946) 166,254 Millennials (1982-2000) 877,693 0 0 1 2 3 4 5 6 7 8 9 85+ 10 11 12 13 14 15 16 17 18 19 20 21 22 23 24 25 26 27 28 29 30 31 32 33 34 35 36 37 38 39 40 41 42 43 44 45 46 47 48 49 50 51 52 53 54 55 56 57 58 59 60 61 62 63 64 65 66 67 68 69 70 71 72 73 74 75 76 77 78 79 80 81 82 83 84 Source: U.S. Census Bureau, Population Division
Minority Share by Age Group: 2010 90% Westside SLC 80% Salt Lake City 70% US 60% Salt Lake County Utah 50% 40% 30% 20% 10% 0% Sources: Bureau of the Census, 2010 Census.
Minority Share of the Population: U.S., Utah, & Salt Lake County & City 60% U.S. 50% State of Utah Salt Lake County 40% Salt Lake City 30% 20% 10% 0% 1900 1910 1920 1930 1940 1950 1960 1970 1980 1990 2000 2010 2020 2030 2040 2050 Sources: Bureau of the Census, Gibson and Jung (2002), Perlich (2002), Kem C. Gardner Policy Institute
Thank you Pamela S. Perlich, Ph.D. Director, Demographic Research Kem C. Gardner Policy Institute, University of Utah gardner.utah.edu Pam.Perlich@utah.edu Voice: 801.581.3358 Fax: 801.581.3354
Kem C. Gardner Policy Institute David Eccles School of Business | 411 E. South Temple Street Salt Lake City, UT 84111 | 801-585-5618 | gardner.utah.edu Facebook.com/gardnerpolicyinstitute Twitter.com/KemGardnerInst