Insights from Anishinabek Nation Socio-Demographic Study Presentation
An overview of the Anishinabek Nation Socio-Demographic Study presented by Leanna Farr focused on various factors such as language usage, population trends, legislative impacts, and projections related to the Registered Indian population growth. The study highlights demographic shifts, language patterns, population growth patterns both on-reserve and off-reserve, and the influence of legislation like the Indian Act amendments on the Anishinabek Nation communities.
Download Presentation

Please find below an Image/Link to download the presentation.
The content on the website is provided AS IS for your information and personal use only. It may not be sold, licensed, or shared on other websites without obtaining consent from the author. Download presentation by click this link. If you encounter any issues during the download, it is possible that the publisher has removed the file from their server.
E N D
Presentation Transcript
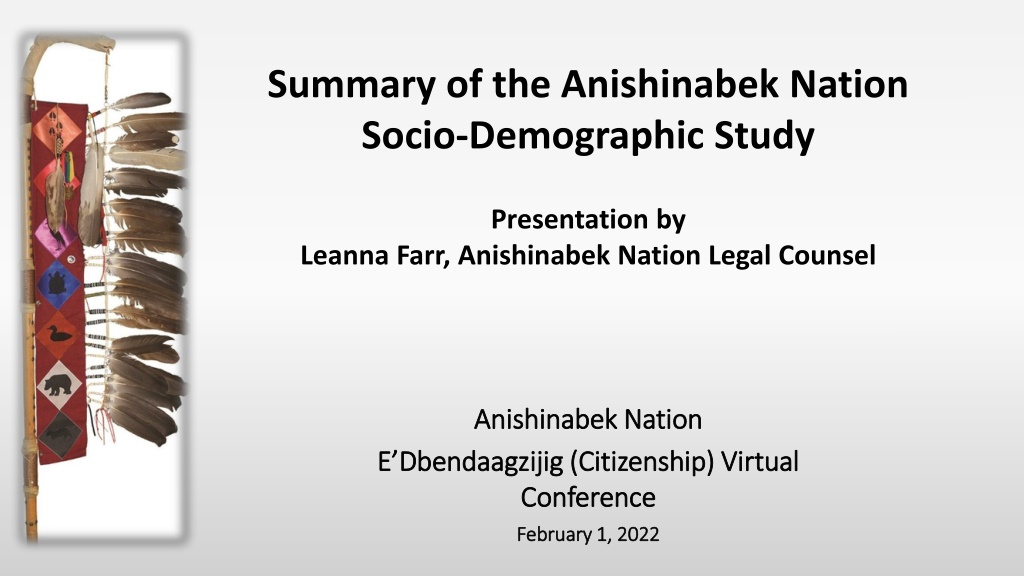
Summary of the Anishinabek Nation Socio-Demographic Study Presentation by Leanna Farr, Anishinabek Nation Legal Counsel Anishinabek Nation Anishinabek Nation E Dbendaagzijig E Dbendaagzijig (Citizenship) Virtual (Citizenship) Virtual Conference Conference February 1, 2022 February 1, 2022
Background Info What was the study about? Anishinabek Socio-demographic study, 2017 Prologica Research & Four Directions Project Consultants & UOI Data from Census of Canada Department of Indian and Northern Affairs Indian Register Data about Age, Gender, Aboriginal Identity, Language Knowledge, Education, Employment, Occupations, Industries, Income
Language Anishinaabemowin Only 4% use Ojibway as primary language in the home Most used in Lake Huron region (17% mother tongue; 7% most frequent language used at home) Highest in Wiikwemkoong Unceded Territory
Population 2002 2016 most growth of Registered Indian population occurred off-reserve; On-reserve only modest growth Registered Indian Population living on-reserve continued to decline 2002 2016 and trend for long-term Anishinabek Nation Region % Growth Registered Indian Population On- Reserve (2002 2016) % Growth Registered Indian Population Off- Reserve (2002 2016) Southwest 14% 41% Southeast 15% 51% Lake Huron 15% 39% Northern Superior 19% 36%
Population Contd Population growth/declines can result from the following: Demographic factors (i.e. natural increase via births deaths) Migration (ex. on-reserve -> off-reserve) Legislation changes 2010 2016 Registered Indian population growths due to legislative amendments (Indian Act Bill C-3) Most additions from 2010 2016 off-reserve 77 additions on-reserve 5,763 additions off-reserve
Indian Act Registration & Populations Parenting between Registered Indian and non-Registered individuals (exogamous parenting) Bill C-3 2010 Indian Act amendments and Bill S-3 2017 amendments will cause initial rise Estimated total 4,966 additions, majority being additions off- reserve Indian Act will impact populations of Anishinabek First Nations in future (Registered versus non-Registered) Registered Indian population projected to rise for about 20 yrs before declining Non-entitled descendants projected to grow rapidly (increase of 230%)
Age Structure Pronounced shifts in Registered Indian populations 2002 2016 declining concentrations of children (0-14 yrs) Rise in older populations; particularly older adults (45-64 yrs) and seniors (65 + yrs) Projected on-reserve growth to slow & shift in age structure of seniors (65+ yrs) to double Aging on-reserve populations projected Off-reserve is even more pronounced
Labour Force Labour force is 15yrs 65+ yrs Registered on-reserve Labour Force expected to grow; however, at slower rates than in past and then decline at the end of 2041 Registered off-reserve Labour Force expected to slow dramatically & eventually decline by 2041 Declines in Labour Force growth = Dependency rates increase Child dependents projected to decline Elderly dependents projected to increase
Educational Attainment 47% residents of Anishinabek First Nations have post-secondary diploma, degree or certificate (inc. Trades, Apprenticeship, College or University) 22% have High School certificate or equivalent AN FN averages are lower than Ontario averages Higher rates of College/Trades/Apprenticeships versus University Degrees Higher rates of men (34%) than women (28%) with no certification Many AN have continued to pursue education as they age Some types of certification have doubled (ex. University and College)
Employment 2016 AN Labour Force participation rate 53% Was 8 points lower than the Ontario average (65%) AN Employment Rate (44%) 16 points lower than Ontario average (60%) Unemployment rate in AN FNs (18%) is more than double the Ontario average (7%) Highest employment in the South regions and lowest Northern Superior and Lake Huron regions Full and part-time and gender not huge discrepancies Self-employment in AN FNs (5%) less than Ontario (12%)
Income 1995 2015 census data income & income sources in AN FNs Average individual income (adjusted for inflation) up 21% from $22,545 in 1995 to $27,327 in 2015 Ontario averages are higher but increase rate similar $39,192 in 1995 and $47,915 in 2015 Average AN incomes range $27,000 - $25,000 (lower in Southwest) Ontario north average income range $43,600 Ontario South average income range $48,000
Income 2015 AN most (both men & women) income from Employment Government Transfer Payments more income source for women than men Other Sources (pension & investments) lowest income source Ontario income from Employment sources much higher than Government Transfer Payments or Other Sources AN Household Income in 2015 was $50,689 versus Ontario $97,865 (AN 52% of Ontario average)
Marital and Family Status Less AN (40%) formally married than Ontario families (71%) AN common law 25% versus Ontario 12% AN single parent families 25% double compared to Ontario 17% Most single parent families are females (26%) versus males (9%) AN lone parent families increased from 27% in 1996 to 36% in 2016 More than 1 in 3 lone parent families (also increase in Ontario, but smaller)
Housing AN has higher rates of housing condition deficiencies 4.4 x higher Over-crowding 1.2 x higher Shared family dwelling 1.2 x higher No improvements of physical conditions of the housing stock on- reserve in past two decades from 1996 2016 Estimated 45% increase of # of Registered Indian households on- reserve over next 25 yrs (most in SW and NS regions) and same for off-reserve Non-family households on-reserve to increase 77% over 2016; more than family households Due to aging population growth
Helpful info for focus of Policy & Supports Language - Anishinaabemowin Citizenship E Dbendaagzijig Aging Population Education Employment Income Housing Families
Miigwetch! Questions or Comments
