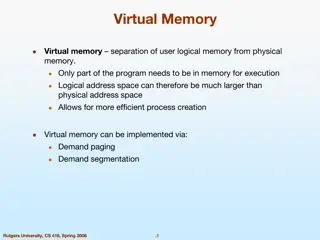
Memory Benchmarking of ARM-Based Systems-on-Chip
This study evaluates memory performance in ARM-based Systems-on-Chip (SoCs) for Data Stream Computing (DSC). It discusses key challenges such as energy efficiency, storage capacity, costs, and memory latencies. The relevance of memory performance in military-led research is highlighted, along with the potential benefits of using SoCs for DSC due to their low power consumption and ease of implementation. The study tests ARM-based SoCs and provides insights into their specifications and performance.

Uploaded on Oct 06, 2024 | 0 Views
Download Presentation

Please find below an Image/Link to download the presentation.
The content on the website is provided AS IS for your information and personal use only. It may not be sold, licensed, or shared on other websites without obtaining consent from the author. Download presentation by click this link. If you encounter any issues during the download, it is possible that the publisher has removed the file from their server.
E N D
Presentation Transcript
A Memory Benchmarking Characterisation of ARM-Based Systems-on-Chip Thomas Wrigley University of the Witwatersrand, Johannesburg, South Africa GRID 2014, Dubna 1
Overview Introduction Using SoCs for DSC Benchmark Results Discussion & Analysis Future Work & Next Steps 2
Data Stream Computing High throughput No/limited offline storage Programming simplicity Requires real-time processing of large amounts of data must address bandwidth efficiency and memory latency issues 3
Key Challenges Some of the problems and concerns faced: 1. Energy-efficiency 2. Offline storage capacity 3. Cost (hardware, electricity, cooling) 4. Memory latencies & bandwidth inefficiencies 4
Existing/Previous Work Relevance of memory performance being increasingly more widely acknowledged Lots of military-led and/or -funded research (DIS & HPCC) Graph500 Benchmark & Green Graph500 (2010 present) High Performance Conjugate Gradient (HPCG) benchmark proposed successor to High Performance LINPACK (HPL) Jack Dongarra Intel has proposed using COTS i7s for signal processing 5
Using SoCs for DSC Looking at the potential for use of SoCs Commercial off-the-shelf (COTS) components Low Power Low-Energy Consumption Require many SoCs potential for large parallelism Implementation & usage tends to be easier Potentially more energy-efficient 6
Using SoCs for DSC (continued) Potentially problematic Consumer-grade ARM chips tend not to have ECC RAM Tested three ARM-based SoCs Will test in due course 7
General Specifications Cortex-A7 Cortex-A9 Cortex-A15 Cores 2 4 4 (+ 4 Cortex-A7) Max CPU Clock (MHz) 1008 996 1596 8
General Specifications Cortex-A7 Cortex-A9 Cortex-A15 Cores 2 4 4 (+ 4 Cortex-A7) Max CPU Clock (MHz) 1008 996 1596 9
General Specifications Cortex-A7 Cortex-A9 Cortex-A15 Cores 2 4 4 (+ 4 Cortex-A7) Max CPU Clock (MHz) 1008 996 1596 10
Memory Specifications Cortex-A7 Cortex-A9 Cortex-A15 L1 Cache (kB) 32 32 32 L2 Cache (kB) 256 1024 2048 RAM (MB) 1024 2048 2048 RAM Type 432 MHz 32 bit DDR3 528 MHz 64 bit DDR3 800 MHz 64 bit DDR3 Theoretical Max Bandwidth (MB/s) 3296 8054 12 207 11
Memory Specifications Cortex-A7 Cortex-A9 Cortex-A15 L1 Cache (kB) 32 32 32 L2 Cache (kB) 256 1024 2048 RAM (MB) 1024 2048 2048 RAM Type 432 MHz 32 bit DDR3 528 MHz 64 bit DDR3 800 MHz 64 bit DDR3 Theoretical Max Bandwidth (MB/s) 3296 8054 12 207 12
Memory Specifications Cortex-A7 Cortex-A9 Cortex-A15 L1 Cache (kB) 32 32 32 L2 Cache (kB) 256 1024 2048 RAM (MB) 1024 2048 2048 RAM Type 432 MHz 32 bit DDR3 528 MHz 64 bit DDR3 800 MHz 64 bit DDR3 Theoretical Max Bandwidth (MB/s) 3296 8054 12 207 13
LMBench Benchmark suite memory performance Focus here is on latencies Cortex-A7 Cortex-A9 Cortex-A15 Clock Cycle Time (ns) 0.992 1.004 0.627 L1 Latency (ns) 3.02 4.02 2.51 L2 Latency (ns) 9.2 30.8 13.8 RAM Latency (ns) 58.5 119.8 104.8 14
LMBench Best Worst Cortex-A7 Cortex-A9 Cortex-A15 Clock Cycle Time (ns) 0.992 1.004 0.627 L1 Latency (ns) 3.02 4.02 2.51 L2 Latency (ns) 9.2 30.8 13.8 RAM Latency (ns) 58.5 119.8 104.8 15
The STREAM Benchmark Generates array of random numbers (which is stored in RAM) and then performs four types of operations Test Equation Copy ? ? = ?(?) Scale ? ? = ? ? ? Add ? ? = ? ? + ?(?) Triad ? ? = ? ? + ? ?(?) 16
STREAM 7000 50 45 Bandwidth Efficiency 6000 Bandwidth (MB/s) 40 5000 35 Cortex- A7 30 4000 25 (%) Cortex- A9 3000 20 15 2000 10 Cortex- A15 1000 5 0 0 Cortex-A7 Cortex-A9 Cortex-A15 Copy (MB/s) Scale (MB/s) Add (MB/s) Triad (MB/s) Bandwidth efficiency percentage of theoretical maximum obtained STREAM Results 17
pmbw - Parallel Memory Bandwidth Benchmark Sustained memory bandwidth Parallel memory bandwidth of multi-core machines Basic inner loops sequential scanning and random memory access 12 subtests Useful to compare to LMBench and STREAM results potentially greater insight 18
pmbw - Parallel Memory Bandwidth Benchmark One benchmark 12 subtests The things that vary: Sequential Scanning vs Random Pointer Permutation Read vs Write 12 subtests ~ 200 to 300 iterations per subtest Scan vs Perm Operations per loop Simple (1) vs Unroll (16) 2400 to 3000 observations Pointer-based iteration vs Index- based array access Bit size of memory transfer 32 vs 64 bits Ptr vs Index 19
Statistical Analysis Analysis of Variance (ANOVA) Are any of the subtest groups different from one another? (statistical significance) How do the subtests compare to: Each other? To STREAM results? Furthermore: How do these subtests group together? 20
Subtest Groupings 6.00E+03 5.00E+03 Bandwidth (MB/s) 4.00E+03 Cortex-A7 3.00E+03 Cortex-A9 2.00E+03 1.00E+03 Cortex- A15 0.00E+00 Random Pointer Permutation SeqRead32Simple SeqWrite32 Simple+Unroll Subtest Grouping Seq32Unroll+64Simp Seq64Unroll 21
Subtest Groupings 6.00E+03 5.00E+03 Bandwidth (MB/s) 4.00E+03 Cortex- A7 3.00E+03 Cortex- A9 2.00E+03 1.00E+03 Cortex- A15 0.00E+00 Subtest Grouping Similar profile to STREAM results 22
Subtest Groupings 6.00E+03 5.00E+03 Bandwidth (MB/s) A9 double A7 A15 only 1.5 times better than A9 4.00E+03 Cortex- A7 3.00E+03 Cortex- A9 2.00E+03 1.00E+03 Cortex- A15 0.00E+00 Subtest Grouping 23
Discussion & Analysis Clear correlation between age of SoC design and memory performance Existing ARM-based SoCs perform fairly well A15 is particularly promising New ARMv8-based SoCs should perform significantly better Promising for ARM-based SoCs in DSC 24
Next Steps & Future Work HPCG & Graph500 Benchmarks DIS & HPCC suites Test newer SoCs (Intel Atom & ARMv8 64 bit) Database stream management software (DBMS) & other benchmarks 25
C Questions or Comments? 26
STREAM Cortex-A7 Cortex-A9 Cortex-A15 STREAM Copy (MB/s) 1996 1329 6066 Scale (MB/s) 1444 1110 6114 Add (MB/s) 757 1448 5413 Triad (MB/s) 702 1290 5275 RAM (Theoretical MB/s) 3296 8054 12 207 RAM BW Efficiency (%) 37 16 47 29
Subtest Groupings 6.00E+03 5.00E+03 Bandwidth (MB/s) 4.00E+03 Cortex-A7 3.00E+03 Cortex-A9 2.00E+03 Cortex-A15 Cortex-A15 1 GHz 1.00E+03 0.00E+00 Perm ScanRead32Sim ScanWrite32 S+U Scan32Un+64Sim Scan64Un Test Type Grouping 30
Random Pointer Permutation Random Pointer Permutation 140 Memory Bandwidth 120 100 (MB/s) 80 60 40 20 0 Cortex-A7 Cortex-A9 Cortex-A15 31
pmbw Subtest Names PermRead32SimpleLoop PermRead32UnrollLoop ScanRead32PtrSimpleLoop ScanRead32IndexSimpleLoop ScanWrite32IndexSimpleLoop ScanWrite32PtrSimpleLoop ScanRead32PtrUnrollLoop ScanRead64PtrSimpleLoop ScanRead64PtrUnrollLoop ScanWrite32PtrUnrollLoop ScanWrite64PtrUnrollLoop ScanWrite64PtrSimpleLoop 32
Random Pointer Permutation C++ Code // PermRead32SimpleLoop uint32_t p = *array; // PermRead32UnrollLoop uint32_t p = *array; while( (uint32_t*)p != array ) p = *(uint32_t*)p; while( (uint32_t*)p != array ) { p = *(uint32_t*)p; // ... 14 more times p = *(uint32_t*)p; } 33
Data-Intensive Systems (DIS) Stressmark Suite Comes from an early 2000s DARPA (US military)-led project Focused on new approaches to solving communication bottlenecks data-starved systems Several project groups proposed very different approaches Approaches ranged from projects with solely software modifications to project groups which proposed and prototyped brand-new architectures, compilers and software 34
High Performance Computing Challenge (HPCC) More recent (again) DARPA-led project Focused on data-intensive computing Consists of 7 tests: Test HPL DGEMM STREAM PTRANS RandomAcce ss FFT b_eff Floating point rate of execution (double precision) Simultaneous inter- processor communicati on Rate of integer random updates of memory (GUPS) Floating point rate of execution Sustainable memory bandwidth Floating point execution of DP complex 1D DFT Communicati on and bandwidth latency Tests 35
Graph500 & Green Graph500 Benchmark Graph500 benchmark of data-intensive computing Alternative/competitor to TOP500 List List is in its infancy RAM requirements exceed current cluster capacity Green Graph500 Energy-efficiency data-intensive communication benchmark Slight modification of Graph500 benchmark 36
PMBW Homogenous Subsets - Odroid Bandwidth Tukey HSDa,b Subset Function Name PermRead32UnrollLoop N 1 2 3 4 5 6 786740597.190892700 196 000000 PermRead32SimpleLoop 791325508.475172800 196 000000 ScanWrite32IndexSimpleLoop 1746008294.74039000 196 0000000 ScanWrite32PtrSimpleLoop 1758569517.30584030 196 0000000 ScanRead32PtrSimpleLoop 1777096605.06313440 196 0000000 ScanRead32IndexSimpleLoop 1784669478.26858000 196 0000000 ScanWrite64PtrSimpleLoop 2499297218.79754400 196 0000000 ScanWrite32PtrUnrollLoop 2666443396.45469140 2666443396.45469140 196 0000000 0000000 ScanRead64PtrSimpleLoop 2670323598.65330550 2670323598.65330550 196 0000000 0000000 ScanWrite32PtrMultiLoop 3038413137.23601200 3038413137.23601200 196 0000000 0000000 ScanRead32PtrUnrollLoop 3158685815.76597360 3158685815.76597360 196 0000000 0000000 ScanWrite64PtrUnrollLoop 3297129002.84576560 196 0000000 ScanRead32PtrMultiLoop 4289022493.19103860 196 0000000 37 ScanRead64PtrUnrollLoop 5037445503.43943700 196 0000000
NAS Parallel Benchmarks Derived from Computational Fluid Dynamics (CFD) simulations CFD is processor-intensive, but two of the NAS benchmarks have memory-intensive aspects to them 38
NAS Parallel Benchmarks Board SoC Cortex-A7 Cortex-A9 Cortex-A15 Operation Type Floating Point Floating Point Floating Point Benchmark Conjugate Gradient, irregular memory access and communication Processes 4 4 4 Mop/s 21.04 73.72 315.15 Mop/s/process 5.26 18.43 78.79 Benchmark Multi-Grid on a sequence of meshes, long- and short-distance communication, memory intensive Processes 4 4 4 Mop/s 154.88 305.76 967.62 Mop/s/process 38.72 76.44 241.90 39
pmbw Parallel Memory Bandwidth 14 sub-tests, each run several hundred times (dependent on array size) lots and lots of info Used Analysis of Variance (ANOVA) to help make sense of this: Cortex-A7 Cortex-A9 Cortex-A15 p = 0.000 Sig. difference between means? p = 0.000 p = 0.000 Effect size N 2744 [14*196] 4200 [14*300] 4200 [14*300] Homogenous subsets (test- groupings) 6 6 5 40


")


 Stressmark Suite")