Understanding Benchmarking for Policy Evaluation
Dive into the world of benchmarking to assess policy effectiveness. Learn the importance of measuring results, setting benchmarks, and utilizing historical data to make informed decisions. Explore real-world examples and guidelines for successful benchmarking practices.

Download Presentation

Please find below an Image/Link to download the presentation.
The content on the website is provided AS IS for your information and personal use only. It may not be sold, licensed, or shared on other websites without obtaining consent from the author. Download presentation by click this link. If you encounter any issues during the download, it is possible that the publisher has removed the file from their server.
E N D
Presentation Transcript
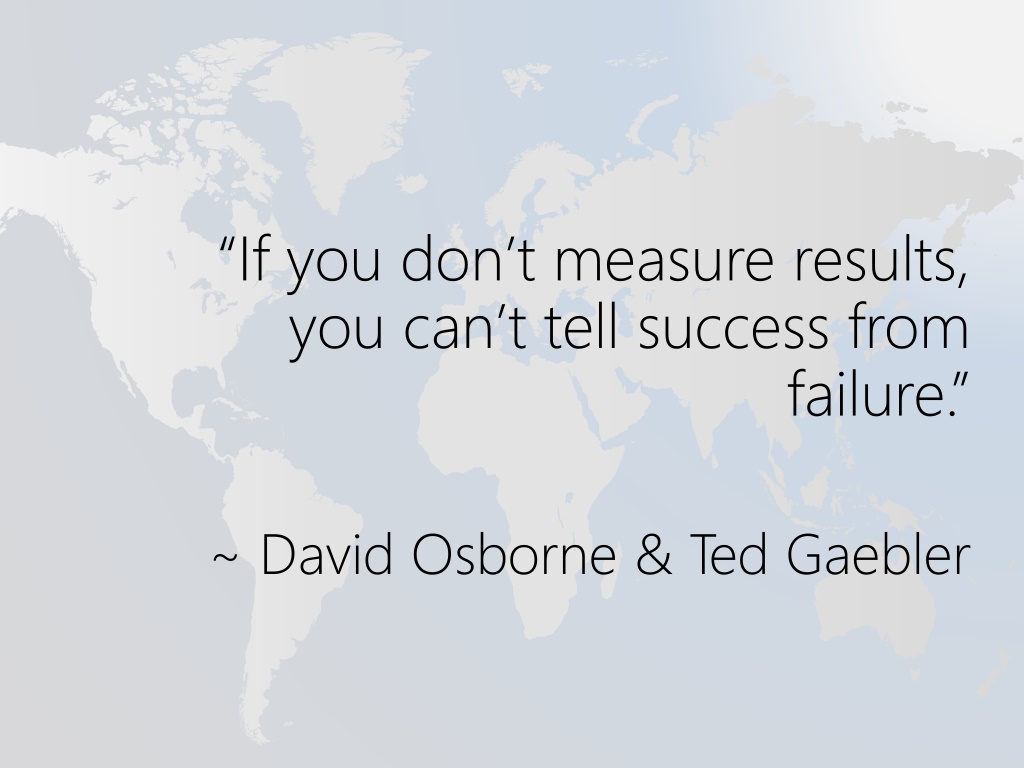
If you dont measure results, you can t tell success from failure. ~ David Osborne & Ted Gaebler
Agenda Agenda Announcements Overview of Benchmarking
Module Module Regrade Instructions Regrade Instructions If you believe a mistake was made grading your module, you can submit a regrade form to potentially receive points back Regrade forms and examples are available under Module 3 Resources on the PST 101 Blackboard site Follow the instructions listed on the regrade form, and use the example for reference to fill out a regrade form Email the form along with your graded Module 3 paper to Sarah Morin, Head Regrade Director at smorin@syr.edu no later than Friday 10/23 Email Sarah with any questions at smorin@syr.edu
Overview of Benchmarking Overview of Benchmarking 8.1-Provide Historical Data on Societal Problem 8.2-Calculate Percent Change Using Excel 8.3-Decide on Years to Use in Your Benchmarks 8.4-Make a Baseline Forecast 8.5-Setting Your Benchmark 8.6-Use Benchmarks to Support Policy Proposal
What is a benchmark? What is a benchmark? A measureable goal of your societal problem that you hope your policy will achieve
Benchmarking Example Benchmarking Example Great Bathroom Debate 72% Over the top of the roll 25% Under the roll 3% Not discernible What s the benchmark? acc-toilet-paper-holder
What to Benchmark What to Benchmark The policy you indicated in Exercise 7.1 A measurable goal for the societal problem you policy seeks to improve.
Ex. 8.1: Historical Data Ex. 8.1: Historical Data One piece of real data at a minimum Provide source for real data and rationale for estimates Print out data source and circle the number Refer to Figure 8.1 on pg. 94 in the Policy in Action book 4 Years ending in most recent calendar year
Where have you used historical data Where have you used historical data (8.1) before and in what module? (8.1) before and in what module? Raise your hand to give us your answer for an extra credit point
Dates Used in 8.1 Dates Used in 8.1 In most cases, use the calendar year (i.e. 2020) In cases dealing with schools, use the academic year (i.e. 2020-2021)
Academic Years Example Academic Years Example Enough of this academic year has passed to estimate for the rest of it. The last piece of historical data should be 2019- -2020e The last piece of historical data should be 2019 2020e School Year First Year Drop Out Rate 2016-2017 2017-2018 7.6% 8.3% 2018-2019 9.9% 2019-2020e 9.1% Source: Office of Institutional Research & Assessment
8.2B Chart Example Figure 8.1: Data on the Number of Larcenies in Residence Halls at Citrus University, per 1,000 students, 2016-2020e Time Period Number of Larcenies 2016-2017 136 Source of Rationale Citrus Univ. Security Dept. Annual Report, 2017 Citrus Univ. Security Dept. Annual Report, 2018 Citrus Univ. Security Dept. Annual Report, 2019 Between July and December 2019, 63 larcenies were reported. The estimate was made for all of 2019-2020e doubling that number because about the same number of larcenies occur each sixth month period. 2017-2018 123 2018-2019 142 2019-2020e 126 Years don t have to be consecutive but must have same intervals between them
Ex. 8.2A: How to Calculate Percent Change Ex. 8.2A: How to Calculate Percent Change Figure 8.1: Data on the Number of Larcenies in Residence Halls at Citrus University, per 1,000 students, 2016-2020e Time Period Number of Larcenies 2016-2017 136 Source of Rationale Citrus Univ. Security Dept. Annual Report, 2017 Citrus Univ. Security Dept. Annual Report, 2018 Citrus Univ. Security Dept. Annual Report, 2019 Between July and December 2019, 63 larcenies were reported. The estimate was made for all of 2019-2020e doubling that number because about the same number of larcenies occur each sixth month period. 2017-2018 123 2018-2019 142 2019-2020e 126 Percent Change equals [(new figure old figure) old figure] x 100 Ex: [(123-136)/136]*100 = -9.6%
Ex. 8.2B Chart Example Ex. 8.2B Chart Example Without Excel between years 1 and 2 (8.2A) Without Excel between years 1 and 2 (8.2A) With Excel for the chart (8.2B) With Excel for the chart (8.2B) Here is what the print out will look like if you do it correctly: Here is what the print out will look like if you do it correctly: Number of Larcenies per 1000 Students Percentage Change Time Period 2016-2017 136 2017-2018 2018-2019 2019- 2020e 123 142 126 -9.6% 15.4% -11.3% Compare 2016-2017 to 2019-2020e -7.4%
Ex. 8.3: Deciding on the Years to Use Ex. 8.3: Deciding on the Years to Use Benchmarks Benchmarks How many years will it take for the policy to have the intended impact? Example: If your policy goes into effect in 2020, start with 2021 Choose 3 years Can be consecutive or not Benchmark can be the same or not
Exercise 8.4: Baseline Forecast Exercise 8.4: Baseline Forecast Baseline Forecast means what happens in the future assuming the policy did not go into effect
Three Approaches to Making a Good Baseline Three Approaches to Making a Good Baseline Forecast for your Societal Problem Forecast for your Societal Problem Assume what has happened in past will continue (see exceptions on next slide) continue (see exceptions on next slide) If pattern has been consistent: use percent change or average percent change to make forecast If historical data has inconsistent pattern: Follow ups and downs, keeping overall percentage change the same Assume what has happened in past will
Exercise 8.4: Baseline Forecast Exercise 8.4: Baseline Forecast Cont Consider conditions that will change the trend Major outside event (ex: economic growth, pandemic) Trend approaching outer limit Demographic factors Cyclical pattern Cont d d
Citrus Trend line Citrus Trend line Figure 8.3-
Exercise 8.5: Choosing Benchmarks Exercise 8.5: Choosing Benchmarks Pay close attention to baseline forecast Decide how powerful factors contributing to societal problem are Estimate strength of government resources in implementing policy Compare to similar areas with similar policies Use authoritative sources
Exercise 8.5: Choosing Benchmarks Exercise 8.5: Choosing Benchmarks Cont Cont d d Historical, Baseline forecast, and Benchmark Graph for Number of Larcenies at Citrus University per 1,000 students. Policy is training sessions for resident students.
Exercise 8.6 Exercise 8.6 Using your Benchmark to support your policy Presentations to players should be short and to the point Create a graph showing trend line, baseline and policy forecast
Module 4 Graphs Module 4 Graphs Follow How to Get an A on the Graphs!!! Found under Module 4 tab of the PST 101 website Read directions carefully + pay attention to detail = NO POINTS LOST
Trend line/Baseline Graph Trend line/Baseline Graph
Exercise 8.6c Exercise 8.6c Compare baseline forecast to policy forecast in specific detail Example: If the policy works, the improvement over the baseline will be x% BE REALISTIC
Trendline Homework Due 10/23 Trendline Homework Due 10/23 Exercises 8.4 and 8.6 require a graph that you will need to practice. Complete the Trendline Homework on Blackboard and send to your TA by next class at 12:45 PM or lose 5 points. If your entire group does it, you will receive 3 extra credit points.
For Next Class For Next Class Trendline Homework due by 12:45 PM on 10/23 Submit Exercises 8.1 and 8.2 to your TA in an email by 12:45 PM on 10/23 Login to Zoom workshop provided by your TA at 12:45 PM on 10/23 Download the Module 4 Competition Word Document from Blackboard to have it available during the workshop on Zoom