Optimizing Data Center Costs with Heterogeneous-Reliability Memory
Reducing data center costs while meeting availability targets is the focus of this study on memory error vulnerabilities. By employing a heterogeneous-reliability memory approach, storing error-tolerant data in less reliable memory and error-vulnerable data in more reliable memory, significant savings in server hardware costs can be achieved. The findings highlight the variability of memory error tolerance across applications and the importance of memory reliability in data centers.
- Data Center Costs
- Memory Error Vulnerabilities
- Heterogeneous-Reliability Memory
- Availability Targets
- System Reliability

Download Presentation

Please find below an Image/Link to download the presentation.
The content on the website is provided AS IS for your information and personal use only. It may not be sold, licensed, or shared on other websites without obtaining consent from the author. Download presentation by click this link. If you encounter any issues during the download, it is possible that the publisher has removed the file from their server.
E N D
Presentation Transcript
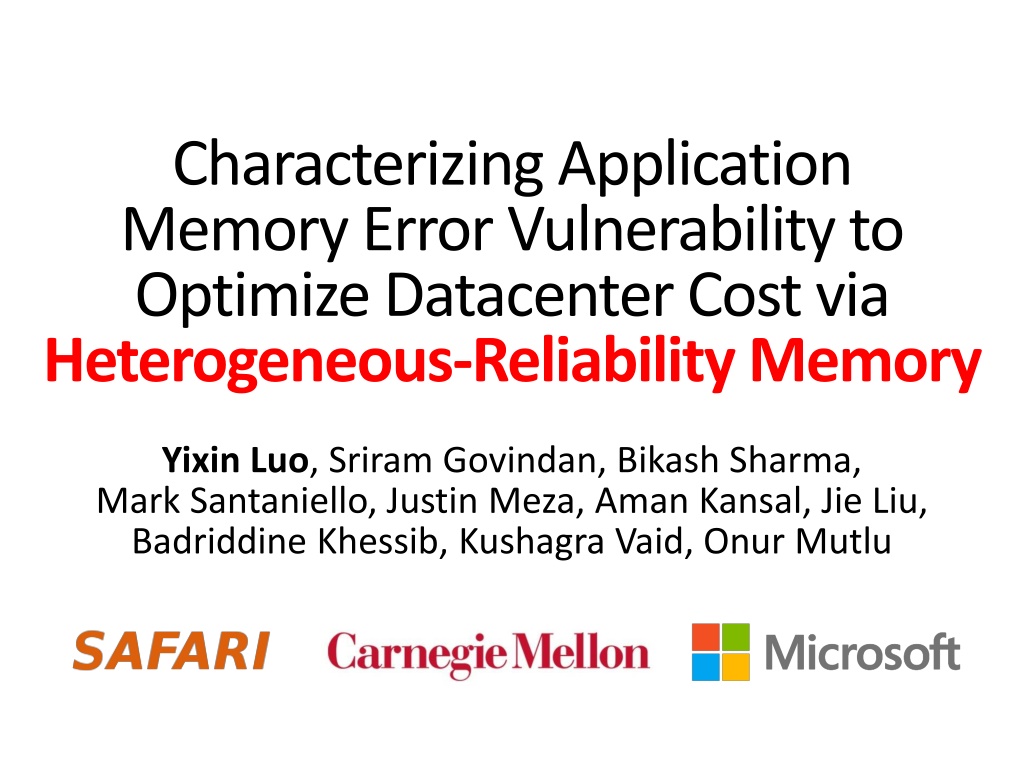
Characterizing Application Memory Error Vulnerability to Optimize Datacenter Cost via Heterogeneous-Reliability Memory Yixin Luo, Sriram Govindan, Bikash Sharma, Mark Santaniello, Justin Meza, Aman Kansal, Jie Liu, Badriddine Khessib, Kushagra Vaid, Onur Mutlu
Executive Summary Problem: Reliable memory hardware increases cost Our Goal: Reduce datacenter cost; meet availability target Observation: Data-intensive applications data exhibit a diverse spectrum of tolerance to memory errors Across applications and within an application We characterized 3 modern data-intensive applications Our Proposal: Heterogeneous-reliability memory (HRM) Store error-tolerant data in less-reliable lower-cost memory Store error-vulnerable data in more-reliable memory Major results: Reduce server hardware cost by 4.7 % Achieve single server availability target of 99.90 % 2
Outline Motivation Characterizing application memory error tolerance Key observations Observation 1: Memory error tolerance varies across applications and within an application Observation 2: Data can be recovered by software Heterogeneous-Reliability Memory (HRM) Evaluation 3
Outline Motivation Characterizing application memory error tolerance Key observations Observation 1: Memory error tolerance varies across applications and within an application Observation 2: Data can be recovered by software Heterogeneous-Reliability Memory (HRM) Evaluation 4
Server Memory Cost is High Server hardware cost dominates datacenter Total Cost of Ownership (TCO) [Barroso 09] As server memory capacity grows, memory cost becomes the most important component of server hardware costs [Kozyrakis 10] 2 CPUs cost ~$500(per CPU) 2 = ~$1000 * 128GB Memory cost ~$140(per 16GB) 8 = ~$1120 * * Numbers in the year of 2014 5
Memory Reliability is Important System/app hang or slowdown System/app crash Silent data corruption or incorrect app output 6
Existing Error Mitigation Techniques (I) Quality assurance tests increase manufacturing cost 12 Testing cost/Mem cost (%) [DocMemory '00] Predicted as trend 10 8 6 4 2 0 1 Mb 4 Mb 16 Mb 64 Mb 256 Mb DRAM chip capacity 1 Gb 4 Gb Memory testing cost can be a significant fraction of memory cost as memory capacity grows 7
Existing Error Mitigation Techniques (II) Error detection and correction increases system cost Increasing strength Added capacity 0.00% 1.56% 12.5% 12.5% 12.5% Added logic No Low Low High High Technique Detection Correction NoECC Parity SEC-DED Chipkill Chipkill N/A 1 bit 2 bit 2 chip 2 chip N/A N/A 1 bit 1 chip 1 chip Parity SEC-DED SEC-DED 1 bit 2 bit 2 bit N/A 1 bit 1 bit 1.56% 12.5% 12.5% Low Stronger error protection techniques have higher cost 8
Shortcomings of Existing Approaches Uniformly improve memory reliability Observation 1: Memory error tolerance varies across applications and with an application Rely only on hardware-level techniques Observation 2: Once a memory error is detected, most corrupted data can be recovered by software Goal: Design a new cost-efficient memory system that flexibly matches memory reliability with application memory error tolerance 9
Outline Motivation Characterizing application memory error tolerance Key observations Observation 1: Memory error tolerance varies across applications and within an application Observation 2: Data can be recovered by software Heterogeneous-Reliability Memory (HRM) Evaluation 10
Characterization Goal Quantify application memory error tolerance corrupted x = 010 x = 110 Memory Error Load Store Masked by Overwrite Consumed by Application x = 000 return x; or *x; if (x != 0) Masked by Logic Incorrect Response System/App Crash Correct Result Incorrect Result Memory Error Outcomes 11
Characterization Methodology 3 modern data-intensive applications Application Memory footprint WebSearch Memcached GraphLab 46 GB 35 GB 4 GB 3 dominant memory regions Heap dynamically allocated data Stack function parameters and local variables Private private heap managed by user Injected a total of 23,718 memory errors using software debuggers (WinDbg and GDB) Examined correctness for over 4 billion queries 12
Outline Motivation Characterizing application memory error tolerance Key observations Observation 1: Memory error tolerance varies across applications and within an application Observation 2: Data can be recovered by software Heterogeneous-Reliability Memory (HRM) Evaluation 13
Observation 1: Memory Error Tolerance Varies Across Applications System/Application Crash 14 Probability of Crash (%) 12 10 8 >10 difference 6 4 2 0 WebSearch Memcached GraphLab Showing results for single-bit soft errors 14 Results for other memory error types can be found in the paper with similar conclusion
Observation 1: Memory Error Tolerance Varies Across Applications Incorrect Responses 1.E+8 # Incorrect/Billion Queries 1.E+7 1.E+6 >105 difference 1.E+5 1.E+4 1.E+3 1.E+2 1.E+1 1.E+0 WebSearch Memcached GraphLab Showing results for single-bit soft errors Results for other memory error types can be found in the paper 15
Observation 1: Memory Error Tolerance Varies and Within an Application Across Applications System/Application Crash 1.4 Probability of Crash (%) 1.2 1 >4 difference 0.8 0.6 0.4 0.2 0 Private Heap Stack Showing results for WebSearch Results for other workloads can be found in the paper 16
Observation 1: Memory Error Tolerance Varies and Within an Application Across Applications Incorrect Responses 1.E+4 # Incorrect/Billion Queries 1.E+3 1.E+2 All averaged at a very low rate 15 1.E+1 1.E+0 Private Heap Stack Showing results for WebSearch Results for other workloads can be found in the paper 17
Outline Motivation Characterizing application memory error tolerance Key observations Observation 1: Memory error tolerance varies across applications and within an application Observation 2: Data can be recovered by software Heterogeneous-Reliability Memory (HRM) Evaluation 18
Observation 2: Data Can be Recovered by Software Implicitly and Explicitly Implicitly recoverable application intrinsically has a clean copy of the data on disk Explicitly recoverable application can create a copy of the data at a low cost (if it has very low write frequency) WebSearch Recoverability 88% 82% Implicitly recoverable 63% 59% 56% 28% Explicitly recoverable 16% 1% Private Heap Stack Overall 19
Outline Motivation Characterizing application memory error tolerance Key observations Observation 1: Memory error tolerance varies across applications and within an application Observation 2: Data can be recovered by software Heterogeneous-Reliability Memory (HRM) Evaluation 20
Exploiting Memory Error Tolerance Memory error vulnerability Vulnerable data data Vulnerable Tolerant data data Tolerant Reliable memory Low-cost memory ECC protected NoECC or Parity Less-tested chips Vulnerable data Well-tested chips Tolerant data App/Data A Heterogeneous-Reliability Memory App/Data B App/Data C 21
Par+R: Parity Detection + Software Recovery Implicit Recovery Explicit Recovery Memory Memory Page A A Page Page Page Page B B B Write Memory Error Memory Error Copy Copy Disk Disk Page A A Intrinsic copy Write non- intensive Page Write intensive 22
Heterogeneous-Reliability Memory App 1 data A App 1 data B App 2 data A App 2 data B App 3 data A App 3 data B Step 1: Characterize and classify application memory error tolerance App 1 data A App 2 data A App 2 data B App 1 data B App 3 data A App 3 data B Vulnerable Tolerant Step 2: Map application data to the HRM system enabled by SW/HW cooperative solutions Reliable Unreliable Reliable memory Parity memory + software recovery (Par+R) Low-cost memory 23
Outline Motivation Characterizing application memory error tolerance Key observations Observation 1: Memory error tolerance varies across applications and within an application Observation 2: Data can be recovered by software Heterogeneous-Reliability Memory (HRM) Evaluation 24
Evaluated Systems Mapping Heap (9 GB) Configuration Pros and Cons Private (36 GB) Stack (60 MB) Typical Server ECC ECC ECC Reliable but expensive Consumer PC HRM Less-Tested (L) HRM/L NoECC NoECC NoECC Par+R NoECC NoECC NoECC NoECC NoECC Least expensive and reliable ECC Par+R NoECC Low-cost and reliable HRM Low-cost but unreliable Parity only Baseline systems HRM systems 25
Design Parameters DRAM/server HW cost [Kozyrakis 10] NoECC memory cost savings Parity memory cost savings Less-tested memory cost savings Crash recovery time Par+R flush threshold Errors/server/month [Schroeder 09] Target single server availability 30% 11.1% 9.7% 18% 12% 10 mins 5 mins 2000 99.90% 26
Evaluation Metrics Cost Memory cost savings Server HW cost savings (both compared with Typical Server) Reliability Crashes/server/month Single server availability # incorrect/million queries 27
Improving Server HW Cost Savings Server HW cost savings (%) 8.1 8 6 4.7 4 3.3 2.9 2 0 Typical Server Consumer PC HRM Less-Tested HRM/L Reducing the use of memory error mitigation techniques in part of memory space can save noticeable amount of server HW cost 28
Achieving Target Availability Single server availability target: 99.90% Single server availability (%) 100 99.5 99 98.5 98 Less-Tested 97.5 97 Typical Server Consumer PC HRM HRM/L HRM systems are flexible to adjust and can achieve availability target 29
Achieving Acceptable Correctness 1000 # incorrect/million queries 163 100 33 12 9 10 1 Typical Server Consumer PC HRM Less-Tested HRM/L HRM systems can achieve acceptable correctness 30
Evaluation Results C:\Users\Yixin\Adobe Flash Builder 4.7\radar-demo\bin-debug\RadarChart_Demo.swf - Internet Explorer Typical Server Consumer PC HRM Less-Tested (L) HRM/L Inner is worse Outer is better Bigger area means better tradeoff 31
Other Results and Findings in the Paper Characterization of applications reactions to memory errors Finding: Quick-to-crash vs. periodically incorrect behavior Characterization of most common types of memory errors including single-bit soft/hard errors, multi-bit hard errors Finding: More severe errors mainly decrease correctness Characterization of how errors are masked Finding: Some memory regions are safer than others Discussion about heterogeneous reliability design dimensions, techniques, and their benefits and tradeoffs 32
Conclusion Our Goal: Reduce datacenter cost; meet availability target Characterized application-level memory error tolerance of 3 modern data-intensive workloads Proposed Heterogeneous-Reliability Memory (HRM) Store error-tolerant data in less-reliable lower-cost memory Store error-vulnerable data in more-reliable memory Evaluated example HRM systems Reduce server hardware cost by 4.7 % Achieve single-server availability target 99.90 % 33
Characterizing Application Memory Error Vulnerability to Optimize Datacenter Cost via Heterogeneous-Reliability Memory Yixin Luo, Sriram Govindan, Bikash Sharma, Mark Santaniello, Justin Meza, Aman Kansal, Jie Liu, Badriddine Khessib, Kushagra Vaid, Onur Mutlu
Why use a software debugger? Speed Our workloads are relatively long running WebSearch 30 minutes Memcached 10 minutes GraphLab 10 minutes Our workloads have large memory footprint WebSearch 46 GB Memcached 35 GB GraphLab 4 GB 35
What are the workload properties? WebSearch Repeat a real-world trace of 200,000 queries, with 400 qps Correctness: Top 4 most relevant documents Document id Relevance and popularity Memcached 30 GB of twitter dataset Synthetic client workload, at 5,000 rps 90% read requests and 10% write requests GraphLab 11 million twitter users following relations, 1.3 GB dataset TunkRank algorithm Correctness: 100 most influential users and their scores 36
How many errors are injected to each application and each memory region? WebSearch 20,576 Memcached 983 GraphLab 2,159 Errors injected to each memory region is proportional to their sizes Application Private Heap Stack Total WebSearch 36 GB 9 GB 60 MB 46 GB Memcached N/A 35 GB 132 KB 35 GB GraphLab N/A 4 GB 132 KB 4 GB 37
Does HRM require HW changes Channel 0 Mem Ctrl 0 Mem Ctrl 1* Mem Ctrl 2* DIMM ECC DIMM ECC Channel 1* CPU DIMM DIMM Channel 2* DIMM DIMM * Memory controller/Channel without ECC support 38
What is the injection/monitoring process? Start 1 (Re)Start App 2 Inject Errors (Soft/Hard) Repeat 3 Run Client Workload 4 App Crash? YES NO 5 Compare Result with Expected Output 39
Comparison with previous works? Virtualized and flexible ECC [Yoon 10] Requires changes to the MMU in the processor Performance overhead ~10% over NoECC Our work: HRM Minimal changes to memory controller to enable different ECC on different channels Low performance overhead Enables the use of less-tested memory 40


")
")