Thailand's Economic Performance and Future Projections: A Detailed Analysis
Thailand has shown impressive growth and poverty reduction over the years, with a significant shift towards sustainable development and inclusive prosperity. The country's economic trajectory, slowdowns amid shocks, and future growth projections highlight key areas for improvement and reform. Structural transformations, social and labor market reforms, and investment surges are essential components for Thailand's continued growth and prosperity.
Download Presentation
Please find below an Image/Link to download the presentation.
The content on the website is provided AS IS for your information and personal use only. It may not be sold, licensed, or shared on other websites without obtaining consent from the author. Download presentation by click this link. If you encounter any issues during the download, it is possible that the publisher has removed the file from their server.

Presentation Transcript
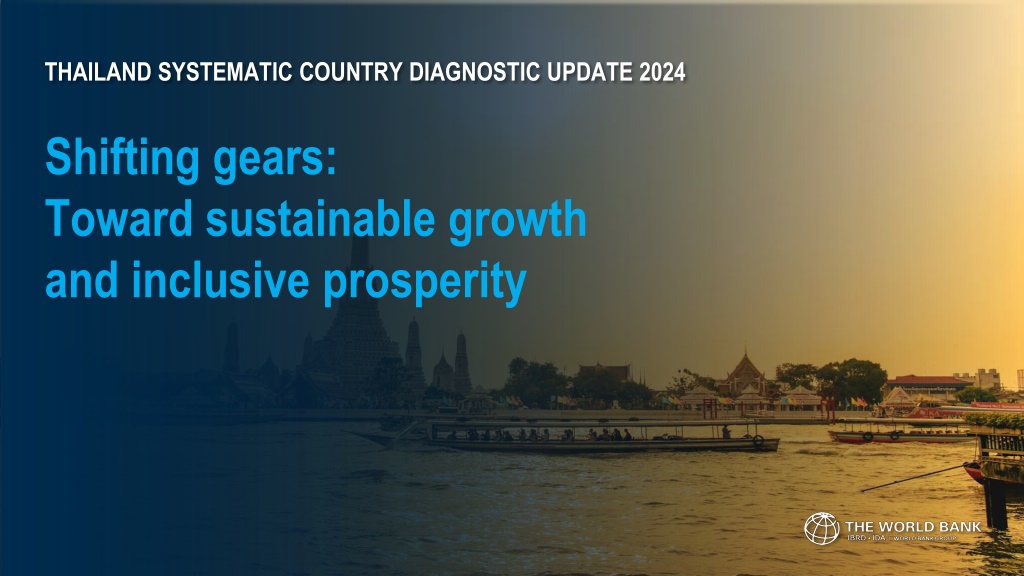
THAILAND SYSTEMATIC COUNTRY DIAGNOSTIC UPDATE 2024 Shifting gears: Toward sustainable growth and inclusive prosperity
How has Thailand performed from a big-picture perspective?
Impressive Growth and Poverty Reduction GDP per capita Structural transformation 80 13 Thailand China 70 12 Korea Share of agriculture in total employment (%) GDP per capita in 2019, log 11 USA 60 ITAJPN KOR MYS GRC MEX THA TUR 10 50 BGR CHN IND 9 IDN PHL 40 VNM VNM 8 30 IDN PHL 7 20 TUR 6 10 MYS POL 5 0 5 6 7 8 9 10 11 12 13 400 1600 6400 25600 GDP per capita in 1980, log GDP per capita (constant 2015 US$) Source: Haver Analytics; World Bank. Left panel: Figure shows GDP per capita (constant price PPP) in 1980 and in 2019. Gray lines show 45-degree lines crossing the origin and Thailand. The latter line indicates constant income gap with Thailand. The sample includes countries with a population of more than two million. Right panel: 1980 2019 for Thailand, China, and Korea. 2020 for other countries. ILO Modelled Estimates.
Economic Slowdown Amid Shocks GDP demand components Trajectory of income growth Poverty and inequality trends US$, thousands 25 - 75pct range MYS MEX TUR USA THA KOR POL ITA Percentage points Percentage points Percent 70 45 Private Consumption Private Consumption Investment Investment Imports Imports Gov. consumption Gov. consumption Exports Exports GDP GDP 30 Gini index (right axis) 60 $6.85 a day (2017 PPP) 16 16 National poverty line 25 50 40 12 12 40 20 8 8 30 4 4 35 20 15 0 0 10 -4 -4 10 0 30 0 2 4 6 8 10 2004 2008 2010 2011 2013 2014 2016 2017 2019 2000 2002 2006 2007 2009 2012 2015 2018 2020 2021 -8 -8 Years since GDP per capita reached USD 15,000 (PPP) 1980-96 1980-96 2000-11 2000-11 2012-19 2012-19 Source: Haver Analytics; Penn World Table, version 10; International Monetary Fund; WDI; Thailand s Labor Force Survey and Household Socio-Economic Survey. World Bank staff calculations. Left panel: Investment stands for Gross Capital formation. Middle panel: Y-axis shows GDP per capita (constant PPP basis), and X-axis shows years since the country reached US$15,000 (Thailand is in 2012). The latest datapoint is 2022.
Future Growth Projections Potential growth, baseline scenario Percentage points Potential growth, illustrative reform scenario TFP Capital Labor Potential growth Structural transformation Social and labor market reforms Education and health improvements Investment surge Baseline Percent 6 6 4 2 4 0 2011-16 2011-16 2017-22 2023-28f 2017-22 2023-28f 2011-16 2017-22 2023-28f 2 0 2011-21 2022-30 Reform Impact 2011-21 2022-30 Reform Impact EMDE EAP excl. China Thailand ASEAN5 THA Source: Kose and Ohnsorge (2023); World Bank. Left panel: EMDE = emerging market and developing economies. Right panel: ASEAN5 includes Thailand (THA), Indonesia (IDN), Malaysia (MYS), and the Philippines (PHL). For Thailand, the structural transformation scenario assumes that the share of employment in agriculture will fall by five percentage points over 10 years starting in 2022 and be equally redistributed to the more productive manufacturing and services sector.
What challenges is Thailand encountering when viewed from a global perspective?
Inadequate and unequal human capital Learning gap Thailand is experiencing rapidly aging population and will become a super-aged society by 2030. 6 Thailand Structural peer 5 Aspirational peer Learning gap, 2020 Thai students have the learning gap of 4 years, and the gap has widened. THA 2020 THA 2010 4 MEX BGR MYS 3 TUR Certain vulnerable groups face exclusion from resources and opportunities POL 2 KOR 1 300 3000 30000 GDP per capita (constant US$), 2020 Source: WDI, World Bank s HCI. Learning gap is the difference between the expected years of school and the learning-adjusted years of school.
Economic Inertia and Lagging Reforms High tech exports Thailand s competitiveness in the global market has declined underperformance in high-tech manufacturing and advanced service sectors. Circle size = Tech products exports share of total exports Global itech. import growth Market share fo tech 7 prodduct exports 6 KOR 5 4 3 MYS Entry of small and innovative disruptors has declined, lagging regional peers VNM THA PHL 2 POL 1 IND IDN 0 -10 0 10 20 30 -1 Tech products exports growth rate Source: WDI, World Bank. 2012-21 average growth rates.
Spatial disparity and connectivity gaps Income and poverty by province Centralization of resources and investment has resulted in infrastructural deficiencies outside Bangkok 80 Thailand's provinces Income group average UMIC threshold Poverty rate at $6.85 a day in 2017 PPP 70 LMIC 60 More than half of Thailand s provinces fall behind the upper-middle-income country (UMIC) threshold 50 HIC threshold (2020) 40 30 Lack of integration between transportation and logistics networks, and between urban areas and border regions 20 UMIC Bangkok 10 Rayong 0 HIC 1500 15000 Income per capita (US$, 2021) Source: NESDC; World Development Indicator Database. 2012-21 average growth rates. GDP per capita for Thailand provinces. GNI per capita for income group averages and thresholds. Poverty rate based on US$6.85 a day in 2017 PPP. The UMIC and HIC income thresholds as of July 2022 and US$ 4,256 and US$ 13,206, respectively.
Environmental degradation and climate risks Impact of different categories of climate damages on GDP (% from baseline) Natural resources are being depleted, with deforestation and worsening air quality Climate change could result in 4% GDP loss by 2050 (without considering extreme events) GHS emissions have steadily increased, challenging carbon neutrality goal by 2050 Source: World Bank. Staff estimates
Institutional challenges Public debt Compared to aspirational peers, Thailand faces challenges in combating corruption, ensuring transparency, and promoting accountability Public debt (% of GDP) 70 60 50 40 30 Low tax revenue compared to similar income countries, poses challenges to long-term fiscal sustainability 20 10 0 FY2005 FY2006 FY2007 FY2008 FY2009 FY2010 FY2011 FY2012 FY2013 FY2014 FY2015 FY2016 FY2017 FY2018 FY2019 FY2020 FY2021 FY2022 FY2023 Control of fiscal resources in Thailand is mostly concentrated in Bangkok, which is leading to regional disparities COVID 19 borrowing decree Other off budget borrowing FIDF and Bond to Compensate FIDF's Loss SOE and agencies Deficit financing and debt management Source: PDMO; World Bank.
How can Thailand leverage this evolving global landscape to pivot towards sustainable growth and foster inclusive prosperity?
HLO 1: Strong human capital Learning Learning- -adjusted years of schooling (Age 25+) adjusted years of schooling (Age 25+) Equal and lifetime access to good quality education Enhance social inclusion and safeguards for vulnerable populations Strengthen the social protection, labour market, and health systems to address the impacts of the aging population and intensified shocks Source: Haver Analytics; World Bank. Distance from the global technological frontier is measured using the log TFP gap.
HLO 2: A competitive and innovative economy Services exports, excluding tourism, Services exports, excluding tourism, global market share and growth global market share and growth 4 IND Promote competition, innovation, and technology adoption Global Market share 3 KOR 2 POL Mobilize sustainable finance MYS 1 THA TUR PHL HUN MEX BGR IDN 0 GEO VNM -5 0 5 10 15 Percent Source: Haver Analytics; World Bank. Circle size is proportional to export share in GDP. Average 2012-19.
HLO 3: Low carbon urban development and connectivity All province 58.44 41.56 Apply an area-based approach to development to unlock investment and growth potential Special economic zones 90.00 10.00 Close infrastructure gaps Inland provinces 51.06 48.94 Unlock the potential of digital data infrastructure Borderland provinces 60.00 40.00 Below potential Exceeding potential Source: Haver Analytics; World Bank.
HLO 4: Sustainable development and protection against natural disasters and climate change Promote environmental sustainability Increase resilience to natural shocks and the effects of climate change Support a sustainable energy transition Source: Haver Analytics; World Bank.
HLO 5: Enabling institutions Reform fiscal institutions and public finance Move towards decentralization Engage in open and participatory processes Improve the governance of state- owned enterprises Source: Haver Analytics; World Bank.