Regional Economic Impacts of Hurricane Disasters: Research Findings and Projections
This study explores the regional economic impacts of hurricane disasters, examining factors such as property losses, vulnerable housing, unemployment rates, and other hazards. Empirical models are used to estimate future property damage, linking these to regional economic trends. The analysis also includes projections on the frequency and intensity of hurricanes under different climate scenarios. Furthermore, the study highlights the connection between hurricane-induced property damages and capital stock growth rates in coastal regions.

Download Presentation

Please find below an Image/Link to download the presentation.
The content on the website is provided AS IS for your information and personal use only. It may not be sold, licensed, or shared on other websites without obtaining consent from the author. Download presentation by click this link. If you encounter any issues during the download, it is possible that the publisher has removed the file from their server.
E N D
Presentation Transcript
REGIONAL ECONOMIC IMPACTS OF HURRICANE DISASTERS Meri Davlasheridze Texas A&M University at Galveston Karen Fisher-Vanden The Pennsylvania State University Ian Sue-Wing Boston University
EMPIRICAL MODEL Hurricane Induced Property Losses: Hurricane Induced Property Losses: ???????? ?????? = ?(??????,??????????,??????????, Housing and Social Vulnerability, ??????????, Other Types of Hazards, ????? ?? ?????? ????????)
RESULTS Variables Log of per capita income 1 year lag of population change 1 year lag of establishment change per capita vulnerable housing Unemployment rate 1 year lag of cum. Hurricane hits Number of hurricane hits dummy for major hurricanes 1 year lag of other types of disasters Coastal county * Tropical storms CRS total credit points BCEGS Building Codes & Design studies Type I Type II Type III Constant Number of observations Beta Standard error 6769.8*** 0.0186*** 0.395*** 27833.0*** 136.5*** 80.61*** 2116.7*** 1089.0*** -302.3*** 252.1*** -0.947*** -581.2*** -24.24*** -127.5*** -10.92*** -0.151*** -102917.2*** (2.58) (0.00) (0.03) (145.40) (3.43) (1.70) (73.43) (102.00) (13.41) (48.86) (0.02) (27.93) (0.64) (4.26) (1.04) (0.03) (26.08) 13040
CONNECTION TO REGIONAL IAM Estimate future regional hurricane property damage from econometric model: Baseline regional estimates of independent variables in the econometric model ?????,?= ?0+ ?1????,?+ ?2 ????,?+ ?3 ????,?+ ?4???.?????,?+ ?5?????.?????,?+ ?6# ?? ????,?+ ?7 ?=1853 ????,?+ ?8(???,?) + ?9(???,? ???????) ? 1 + ?10?? ?? ????,? 1+ ?11(??????,?)
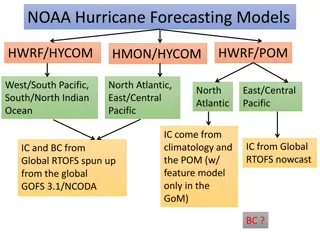
CONNECTION TO REGIONAL IAM Hurricane projection data Dynamic Downscaling Model of Knutson et al. (2012) combines Regional atmospheric model for seasonal Atlantic simulations (Zetac) Hurricane prediction model (GFDL hurricane model) Several global climate model (CMIP3 & CMIP5) Fewer Atlantic tropical storms in warmer climates Increase in the frequency of the most intense hurricanes Emanuel, 2013 Downscaling 6 different CMIP5 climate models Increased tropical cyclone activity over the 21st century under RCP8.5 emissions scenario
6 CONNECTION TO REGIONAL IAM Input hurricane-induced property damages in the CGE model Empirical Model Property damages in the coastal regions (1989-2009) the negative of capital stock growth rate compared to the base year (i.e. the data year used for calibration) CGE KLEM KLEM= 0.6 KL= 1 KL EM EM= 0.7 Capital stock Depreciation rate Investment demand by household Region Households Year Time period Capital endowment Capital endowment in benchmark Multifactor productivity index Multifactor productivity growth rate Number of years per period K K L E M I r h t tp evok evok0 mfp mfp_gr nyrs E= 0.8 M= 0.6 M1 M27 . OG PRP NGD C ELE = + (1 ) K K I Capital stock , , 1 r t , r t r t ? ?,?? + 1 ? ?,"tp=base year" ???? ?, = ????0 ?, ??? mfp = mfp*(1 + mfp_gr)**nyrs(tp)
CONNECTION TO REGIONAL IAM Scenario analysis: Hurricane damages without climate change Under different adaptation scenarios Hurricane damages with climate change Under different adaptation scenarios
THANK YOU! QUESTIONS?
Last email from Tom Knutson Meri, The Zetac model tracks we sent you (which can extend beyond 5-days if the storm lasts that long) should give you landfalling information for the storms for both climate change and no-warming scenario you mention. Unfortunately, the hurricane model downscale of the individual cases typically does not include the landfall time (as they are limited to 5-days maximum), so the intensity information you can derive for landfalling is quite limited, as it is coming basically only from the zetac model, which has intensities limited below 50 m/s in surface winds. An extension of the cases to include US landfall is a relatively big project which we have talked about doing, but its not at the top of our queue at this time. An alternative might be a statistical downscale of the US landfall intensities from the zetac intensities using the method described in the paper. Joe could probably help with that. However, landfall intensities may have some extra issues that make it trickier to handle (i.e., we only have 6-hourly data and so can't have apples to apples comparison of landfall intensity between different cases, as the 6-hour data can't resolve the true landfall that well). I hope this information gives you some feel for the issues at hand. Joe might have some other thoughts to add. -- Tom Knutson