Understanding Graphs of Functions in Mathematics
Learn how to draw the graph of a function using its equation. Explore examples such as plotting the graph of f(x) = 2x + 1 and f(x) = x^2 + 1 within specific ranges. Understand the process of creating tables of values, plotting points accurately, and connecting them with straight lines or smooth curves to represent functions graphically.

Download Presentation

Please find below an Image/Link to download the presentation.
The content on the website is provided AS IS for your information and personal use only. It may not be sold, licensed, or shared on other websites without obtaining consent from the author. Download presentation by click this link. If you encounter any issues during the download, it is possible that the publisher has removed the file from their server.
E N D
Presentation Transcript
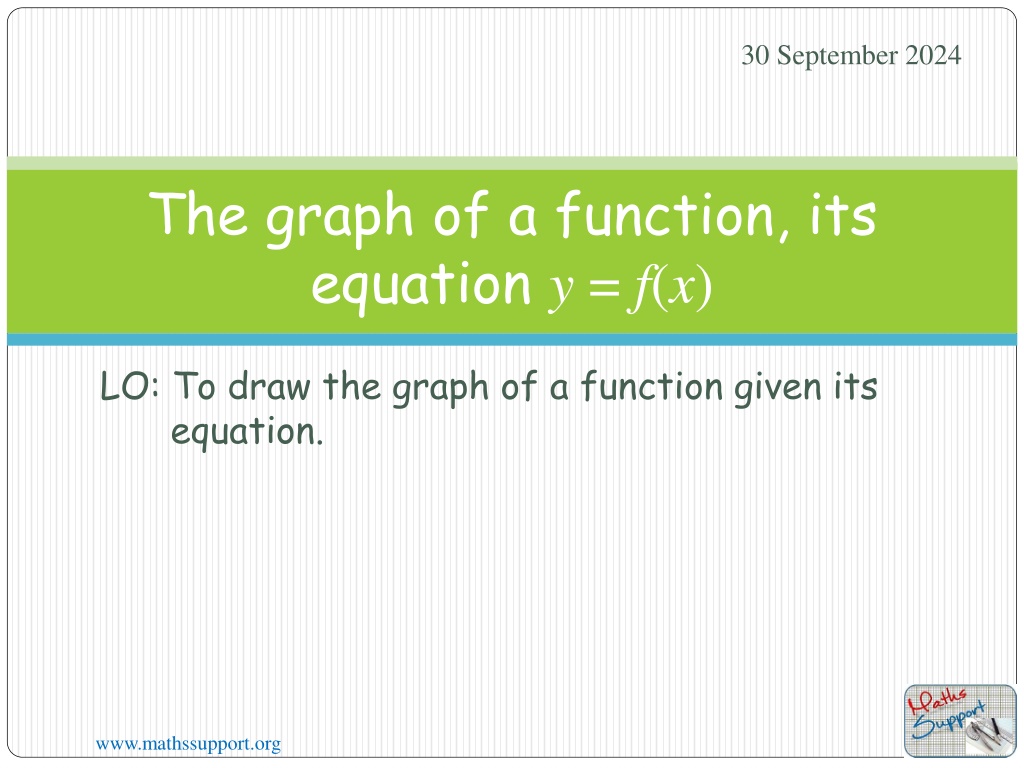
30 September 2024 The graph of a function, its equation y = f(x) LO: To draw the graph of a function given its equation. www.mathssupport.org
The graph of a function Every function has a particular behaviour and is identified by a specific shape. There are two ways to represent the graph of a function. Drawing its graph. Sketching its graph. In this lesson we will be working on Drawing the graph of a function If you are asked to draw the graph of a function is to represent by means of a labelled, accurate diagram or graph, using a pencil. A ruler (straight edge) should be used for straight lines. Graphs should have points correctly plotted (if appropriate) and joined in a straight line or smooth curve. www.mathssupport.org
The graph of a function Draw the graph of f(x) = 2x + 1 for 3 x 3. We can create a table of values that combines the inputs and outputs y 10 9 -3 -5 -2 -3 -1 -1 0 1 1 3 2 5 3 7 x 8 y = f(x) 7 (-2,-3)(-1,-1) (0, 1) (1, 3) (2, 5) (-3,-5) (3, 7) (x, y) 6 5 We will use values from -3 through 3 for x and from them, we will evaluate the function to find the corresponding value of y Plot the points accurately. Use a ruler to join the points. 4 3 f(x) = 2x + 1 2 1 x 1 2 3 4 5 6 6 5 4 3 2 1 -1 -2 -3 -4 -5 www.mathssupport.org
The graph of a function Draw the graph of f(x) = x2 1 for 3 x 3. We can create a table of values that combines the inputs and outputs y f(x) = x2 1 10 9 -3 8 -2 3 -1 0 0 -1 1 0 2 3 3 8 x 8 y = f(x) 7 (-3,8) (-2,3) (-1,0) (0, -1)(1, 0) (2, 3) (3, 8) (x, y) 6 5 We will use values from -3 through 3 for x and from them, we will evaluate the function to find the corresponding value of y Plot the points accurately. Draw a smooth curve joining the points. 4 3 2 1 x 1 2 3 4 5 6 6 5 4 3 2 1 -1 -2 -3 -4 -5 www.mathssupport.org
The graph of a function Using the GDC We are going to use Graphing display calculator to generate the table. Select the Calculator you are using. CASIO Texas Instruments CASIO Texas Instruments www.mathssupport.org
The graph of a function Draw the graph of f(x) = x3 x2 7x 1 for 2 x 3. We can create a table of values that combines the inputs and outputs -2 -1 0 1 2 3 x y = f(x) (x, y) We will use values from 2 through 3 for x and from them, we will evaluate the function to find the corresponding value of y Now we are going to use the GDC to construct a table of values for 2 x 3 .Turn on the GDC. Press 7 Table www.mathssupport.org
The graph of a function Draw the graph of f(x) = x3 x2 7x 1 for 2 x 3. We can create a table of values that combines the inputs and outputs -2 -1 0 1 2 3 x y = f(x) (x, y) Type in the function x3 x2 7x 1 EXE www.mathssupport.org
The graph of a function Draw the graph of f(x) = x3 x2 7x 1 for 2 x 3. We can create a table of values that combines the inputs and outputs -2 -1 0 1 2 3 x y = f(x) (x, y) EXE Type in the function x3 x2 7x 1 Press F5 Set www.mathssupport.org
The graph of a function Draw the graph of f(x) = x3 x2 7x 1 for 2 x 3. We can create a table of values that combines the inputs and outputs -2 -1 0 1 2 3 x y = f(x) (x, y) EXE Type in the function x3 x2 7x 1 Press F5 Set Set the boundaries Start -2 EXE EXE EXE End 3 Step 1 www.mathssupport.org
The graph of a function Draw the graph of f(x) = x3 x2 7x 1 for 2 x 3. We can create a table of values that combines the inputs and outputs -2 -1 0 1 2 3 x y = f(x) (x, y) EXE Type in the function x3 x2 7x 1 Press F5 Set Set the boundaries Start -2 EXE EXE EXE End 3 Step 1 Press F6 Table www.mathssupport.org
The graph of a function Draw the graph of f(x) = x3 x2 7x 1 for 2 x 3. We can create a table of values that combines the inputs and outputs -2 1 -1 4 0 -1 1 -8 2 3 x -11 -4 y = f(x) (-2,1) (-1,4) (0, -1)(1,-8)(2,-11) (3,-4) (x, y) EXE Type in the function x3 x2 7x 1 Press F5 Set Set the boundaries Start -2 EXE EXE EXE End 3 Step 1 Press F6 Table Scroll down and fill in the table www.mathssupport.org
The graph of a function Draw the graph of f(x) = x3 x2 7x 1 for 2 x 3. We can create a table of values that combines the inputs and outputs y 5 f(x) = x3 x2 7x 1 4 3 -2 1 -1 4 0 -1 1 -8 2 3 x 2 -11 -4 y = f(x) 1 x (-2,1) (-1,4) (0, -1)(1,-8)(2,-11) (3,-4) (x, y) 3 2 1 1 2 3 -1 Plot the points accurately. Draw a smooth curve joining the points. -2 -3 -4 -5 --6 -7 -8 -9 -10 -11 Click to end Click to end www.mathssupport.org
The graph of a function Draw the graph of f(x) = x3 x2 7x 1 for 2 x 3. We can create a table of values that combines the inputs and outputs -2 -1 0 1 2 3 x y = f(x) (x, y) We will use values from 2 through 3 for x and from them, we will evaluate the function to find the corresponding value of y Now we are going to use the GDC to construct a table of values for 2 x 3 .Turn on the GDC. Press Y = www.mathssupport.org
The graph of a function Draw the graph of f(x) = x3 x2 7x 1 for 2 x 3. We can create a table of values that combines the inputs and outputs -2 -1 0 1 2 3 x y = f(x) (x, y) Type in the function x3 x2 7x 1 enter www.mathssupport.org
The graph of a function Draw the graph of f(x) = x3 x2 7x 1 for 2 x 3. We can create a table of values that combines the inputs and outputs -2 -1 0 1 2 3 x y = f(x) (x, y) enter Type in the function x3 x2 7x 1 Press 2nd tblset www.mathssupport.org
The graph of a function Draw the graph of f(x) = x3 x2 7x 1 for 2 x 3. We can create a table of values that combines the inputs and outputs -2 -1 0 1 2 3 x y = f(x) (x, y) EXE Type in the function x3 x2 7x 1 Press F5 Set Table Setup enter TblStart = -2 Tbl = 1 enter Indpnt: Auto Depen: Auto table 2nd www.mathssupport.org
The graph of a function Draw the graph of f(x) = x3 x2 7x 1 for 2 x 3. We can create a table of values that combines the inputs and outputs -2 -1 0 1 2 3 x y = f(x) (x, y) EXE Type in the function x3 x2 7x 1 Press F5 Set Table Setup enter TblStart = -2 Tbl = 1 Indpnt: Auto Depen: Auto enter table 2nd www.mathssupport.org
The graph of a function Draw the graph of f(x) = x3 x2 7x 1 for 2 x 3. We can create a table of values that combines the inputs and outputs -2 1 -1 4 0 -1 1 -8 2 3 x -11 -4 y = f(x) (-2,1) (-1,4) (0, -1)(1,-8)(2,-11) (3,-4) (x, y) Scroll down and fill in the table www.mathssupport.org
The graph of a function Draw the graph of f(x) = x3 x2 7x 1 for 2 x 3. We can create a table of values that combines the inputs and outputs y 5 f(x) = x3 x2 7x 1 4 3 -2 1 -1 4 0 -1 1 -8 2 3 x 2 -11 -4 y = f(x) 1 x (-2,1) (-1,4) (0, -1)(1,-8)(2,-11) (3,-4) (x, y) 3 2 1 1 2 3 -1 Plot the points accurately. Draw a smooth curve joining the points. -2 -3 -4 -5 --6 -7 -8 -9 -10 -11 www.mathssupport.org
Thank you for using resources from A close up of a cage Description automatically generated For more resources visit our website https://www.mathssupport.org If you have a special request, drop us an email info@mathssupport.org Get 20% off in your next purchase from our website, just use this code when checkout: MSUPPORT_20 www.mathssupport.org