Data Grouping and Representation in Statistics
In this set of data examples, a computer game company collects and groups ages of players, while the post office records the weights of letters. The challenges include creating non-overlapping groups for ages and ensuring inclusivity for continuous weight data. The visual representations aid in understanding and analyzing the data effectively.

Download Presentation

Please find below an Image/Link to download the presentation.
The content on the website is provided AS IS for your information and personal use only. It may not be sold, licensed, or shared on other websites without obtaining consent from the author. Download presentation by click this link. If you encounter any issues during the download, it is possible that the publisher has removed the file from their server.
E N D
Presentation Transcript
A computer game company wanted to know the ages of the people playing its game. The company took a sample of 20 people. 15, 18, 41, 28, 32, 16, 18, 22, 31, 25 14, 24, 20, 45, 36, 27, 40, 19, 38, 29 We have a lot of unique values. 3 Frequency 2 1 0 18 20 38 15 18 41 28 32 16 22 31 25 14 24 45 36 27 40 19 29 Age
A computer game company wanted to know the ages of the people playing its game. The company took a sample of 20 people. 15, 18, 41, 28, 32, 16, 18, 22, 31, 25 14, 24, 20, 45, 36, 27, 40, 19, 38, 29 The game company puts the data into 4 groups, what is the problem? 20 40 29 19 38 27 14 18 36 25 22 24 16 45 41 31 15 18 32 28 10 to 20 20 to 30 30 to 40 40 to 50 The groups cannot overlap.
A computer game company wanted to know the ages of the people playing its game. The company took a sample of 20 people. 15, 18, 41, 28, 32, 16, 18, 22, 31, 25 14, 24, 20, 45, 36, 27, 40, 19, 38, 29 20 40 29 20 19 38 27 40 14 18 36 25 22 24 16 45 31 4 1 15 18 32 28 10 to 19 20 to 29 30 to 39 40 to 49 Grouping the data makes it easier to represent.
A computer game company wanted to know the ages of the people playing its game. The company took a sample of 20 people. 15, 18, 41, 28, 32, 16, 18, 22, 31, 25 14, 24, 20, 45, 36, 27, 40, 19, 38, 29 7 6 5 Frequency 4 3 2 1 0 10-19 20-29 30-39 40-49 Age Group
The post office records the weight of letters sent through the post. To monitor output, a sample of 20 letters is taken. 43.2 g, 29.5 g, 40.0 g, 28.1 g, 23 g, 35.5 g, 52.1 g, 21.7 g, 25.3 g, 32.4 g 21.1 g, 42.6 g, 38.1 g, 39.2 g, 23.7 g, 34.5 g, 49.1 g, 21.3 g, 25.9 g, 32.2 g What groups could we put this data into? 20 to 29 g 30 to 39 g 40 to 49 g 50 to 59 g What is the problem with these groups? Some values are between the groups.
The post office records the weight of letters sent through the post. To monitor output, a sample of 20 letters is taken. 43.2 g, 29.5 g, 40.0 g, 28.1 g, 23 g, 35.5 g, 52.1 g, 21.7 g, 25.3 g, 32.4 g 21.1 g, 42.6 g, 38.1 g, 39.2 g, 23.7 g, 34.5 g, 49.1 g, 21.3 g, 25.9 g, 32.2 g Continuous data like this can have an infinite number of values. The groups must be able to include any value. 29.999 g 40.0 g 50.00001 g 20 g 25 g 30 g 35 g 40 g 45 g 50 g 55 g 60 g 20 < w 30 30 < w 40 40 < w 50 50 < w 60 Greater than 30, smaller than or equal to 40
A flower-company measures the height (h) of its flowers after 2 weeks. One flower is 26.7 cm in height. Place this piece of data on the number line. Which group would it go into? 26.7 cm 30 20 25 35 40 45 50 55 60 20 < h 30 30 < h 40 40 < h 50 50 < h 60
A flower-company measures the height (h) of its flowers after 2 weeks. One flower is 50.5 cm in height. Place this piece of data on the number line. Which group would it go into? 50.5 cm 30 20 25 35 40 45 50 55 60 20 < h 30 30 < h 40 40 < h 50 50 < h 60
A flower-company measures the height (h) of its flowers after 2 weeks. One flower is 39.9 cm in height. Place this piece of data on the number line. Which group would it go into? 39.9 cm 30 20 25 35 40 45 50 55 60 20 < h 30 30 < h 40 40 < h 50 50 < h 60
A flower-company measures the height (h) of its flowers after 2 weeks. One flower is 50 cm in height. Place this piece of data on the number line. Which group would it go into? 50 cm 30 20 25 35 40 45 50 55 60 20 < h 30 30 < h 40 40 < h 50 50 < h 60
A flower-company measures the height (h) of its flowers after 2 weeks. One flower is 30 cm in height. Place this piece of data on the number line. Which group would it go into? 30 cm 30 20 25 35 40 45 50 55 60 20 < h 30 30 < h 40 40 < h 50 50 < h 60
A flower-company measures the height (h) of its flowers after 2 weeks. One flower is 40 cm in height. Place this piece of data on the number line. Which group would it go into? 40 cm 30 20 25 35 40 45 50 55 60 20 < h 30 30 < h 40 40 < h 50 50 < h 60
A class took a science test: here are their scores. A farmer sampled the height (cm) of some wheat stalks. This frequency table shows individual donations made to a charity. 19 22 10 36 25 30 35 25 15 21 24 32 27 8 29 12 Donations, ? ( ) 10 <? 30 30 <? 50 50 <? 70 Freq. 10 7 2 22 83 90 122 17.2 60.7 114 34 57 40 88 76 148 15 95 90.5 60 120 70 41 Complete a grouped frequency table with this data. 1) What is the greatest total amount the charity might have received? Summarise this data in a grouped frequency table with 5 groups. Score 0-9 10-19 20-29 30-39 Frequency Height, ? (cm) < Freq. 2) Estimate a total for donations that were 50 or less. How many students scored more than 19?
A class took a science test: here are their scores. A farmer sampled the height (cm) of some wheat stalks. This frequency table shows individual donations made to a charity. 19 22 10 36 25 30 35 25 15 21 24 32 27 8 29 12 Donations, ? ( ) 10 <? 30 30 <? 50 50 <? 70 Freq. 10 7 2 22 83 90 122 17.2 60.7 114 34 57 40 88 76 148 15 95 90.5 60 120 70 41 Complete a grouped frequency table with this data. 1) What is the greatest total amount the charity might have received? 300 + 350 + 140 = 790 Summarise this data in a grouped frequency table with 5 groups. Score 0-9 10-19 20-29 30-39 30-39 Score 0-9 10-19 20-29 Frequency Frequency 1 4 7 4 Height, ? (cm) < 0 < 30 30 <? 60 60 <? 90 90 <? 120 120 <? 150 Height, ? (cm) Freq. Freq. 3 5 6 4 2 2) Estimate a total for donations that were 50 or less. 20 10 + 40 7 = 480 How many students scored more than 19?11
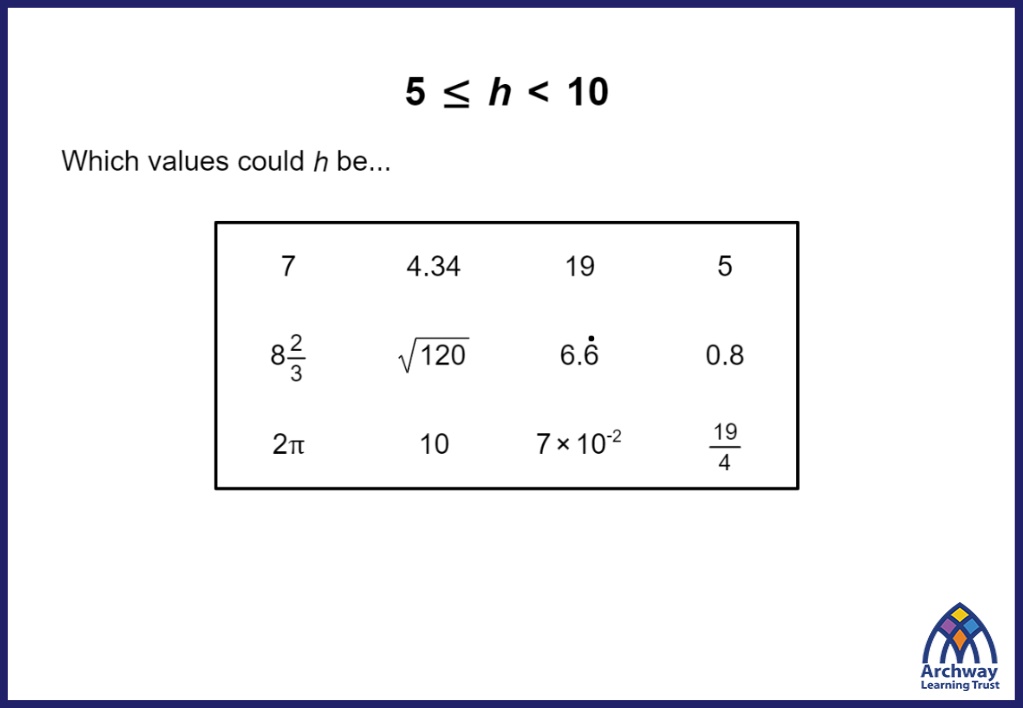
Challenge Which statements are true?


 of its flowers")
 of its flowers")
 of its flowers")
 of its flowers")
 of its flowers")
 of its flowers")