PySAT Point Spectra Tool: Spectral Analysis and Regression Software
PySAT is a Python-based spectral analysis tool designed for point spectra processing and regression tasks. It offers various features such as preprocessing, data manipulation, multivariate regression, K-fold cross-validation, plotting capabilities, and more. The tool's modular interface allows users to design workflows, save, and restore them. PySAT is open-source, flexible, and under continuous development to enhance functionalities like dimensionality reduction, outlier removal, and calibration transfer methods.

Download Presentation

Please find below an Image/Link to download the presentation.
The content on the website is provided AS IS for your information and personal use only. It may not be sold, licensed, or shared on other websites without obtaining consent from the author. Download presentation by click this link. If you encounter any issues during the download, it is possible that the publisher has removed the file from their server.
E N D
Presentation Transcript
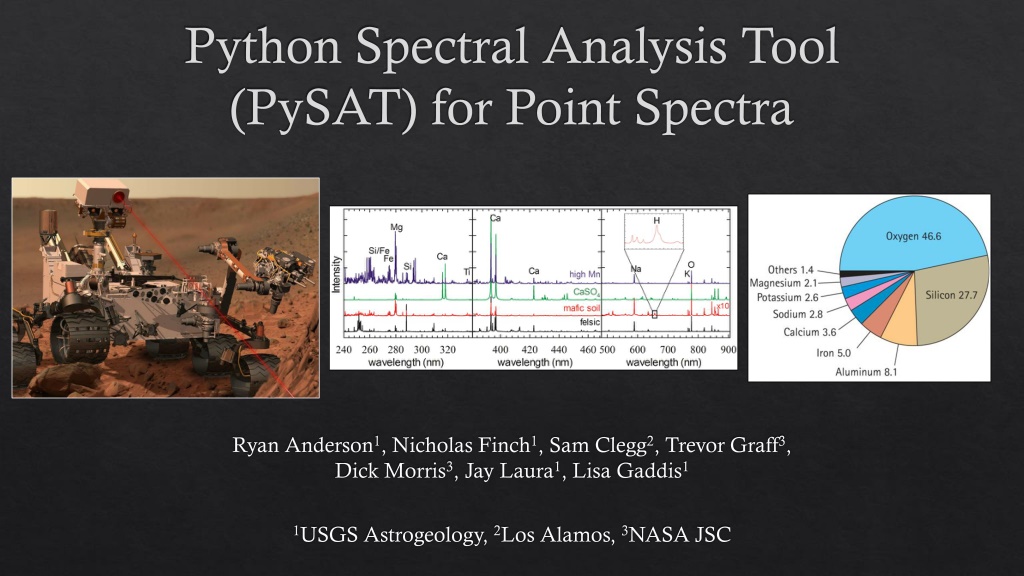
Python Spectral Analysis Tool (PySAT) for Point Spectra Ryan Anderson1, Nicholas Finch1, Sam Clegg2, Trevor Graff3, Dick Morris3, Jay Laura1, Lisa Gaddis1 1USGS Astrogeology, 2Los Alamos, 3NASA JSC
What does PySAT Do? Preprocessing and data manipulation: Masking Normalization Remove rows (improvements soon) Define folds, training, test sets Continuum removal (multiple algorithms) Dimensionality reduction (PCA, ICA, etc.) Calibration Transfer (in progress) Peak fitting (coming soon) Band math (coming soon) Peak binning (new) Etc. Multivariate Regression K-fold cross validation Train multivariate regression models (leverage scikit-learn): Ordinary Least Squares (OLS) Partial Least Squares (PLS) Gaussian Process (GP) Support Vector Machines (SVM) Bayesian Ridge Regression (BRR) Lasso Elastic net Orthogonal Matching Pursuit (OMP) Least Angle Regression (LARS) Automatic Relevance Determination (ARD) Blend sub-models
What does PySAT Do? It helps scientists stir the pile ! https://xkcd.com/1838/
PySAT Point Spectra Tool: Interface Tool is designed with a modular interface Works with .csv files Users can design workflows composed of discrete data processing steps Workflows can be saved and restored
Conclusion PySAT point spectra tool is spectra processing and regression software Free Open source Python-based (leverages scikit-learn and other libraries) Graphical interface Flexible but powerful Development is ongoing: Streamlining code and interface Clustering and classification Improve dimensionality reduction Outlier removal Band math Peak fitting More advanced data manipulation Calibration transfer methods Etc. Want to try it? https://github.com/USGS- Astrogeology/PySAT https://github.com/USGS- Astrogeology/PySAT_Point_Spectra_GUI Is PySAT missing some capability you would use? Let me know! Ryan Anderson rbanderson@usgs.gov