Developing a Graphical User Interface for High-Resolution X-ray Spectra Analysis
High-resolution X-ray spectra analysis can be challenging due to the complex nature of the information contained within. This project aims to simplify the process by developing a user-friendly graphical interface that enables users to visualize, analyze, and interpret X-ray spectra data effectively. The tool includes features like spectral display, detector characteristics, redshift handling, iterative detection, diagnostic capabilities, and model generation. Built in Python using standard libraries, this GUI tool streamlines the analysis of X-ray spectra, making it accessible to a wider range of researchers and enthusiasts.

Download Presentation

Please find below an Image/Link to download the presentation.
The content on the website is provided AS IS for your information and personal use only. It may not be sold, licensed, or shared on other websites without obtaining consent from the author. Download presentation by click this link. If you encounter any issues during the download, it is possible that the publisher has removed the file from their server.
E N D
Presentation Transcript
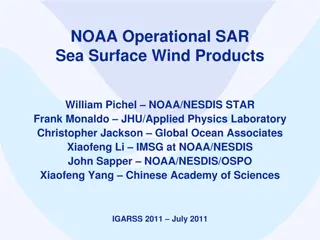
A GUI for High Resolution X-ray Spectra T. Kallman, L. Angelini, M. Witthoeft, F. Paerels, J. Kaastra 9/25/2024 1
Background Spectra contain large amounts of information, but deriving this information can be challenging both conceptually and procedurally In the optical band science results are derived from discrete diagnostics , i.e. line ratios or equivalent, based on quantities which can be measured directly from an observed spectrum. In the X-ray band finite spectral resolution and counting statistics mean this is often not possible. General results depend on modeling , i.e. producing synthetic data from models and then iteratively correcting. This procedure requires knowledge of fitting tools and may obscure the model physics. It is familiar and straightforward for experts, but raises the barrier for entry to the field by outsiders. For Hitomi (Astro-H) we have tried to build a tool which alleviates some of these problem. 9/25/2024 2
Overview Procedure is outlined: 9/25/2024 3
General list of features to include Spectra treated as optical data (without RMF) Graphical interface to display spectrum with several capabilities Show detector feature & abs edges & considering how to treat Redshift Binning capability X-axis ADC & keV ; Yaxis Count/s & flux Re-iterative Detection capability Line detected compared : With list of bright lines Line diagnostics to id for example line series Guess out the plasma type (Photoionized, Coronal, NEI etc ..) Outputs xspec style model with guess lines 9/25/2024 4
Current development Build in Python uses standard libraries numpy , matplotlib & astropy Diagnostics Detect redshift/velocity Apply diagnostics Look for line series (K /K ) Prepare xspec/etc input View capability Read type I & II spectra Read ARF Compute photon flux Easy navigation Software features: Logging Save/Load sessions Undo/redo Scripting Rebinning Save plot to file Automatic feature detection Choose criterion Display individual features correct identify Load atomic line/edge list ID by energy Filter atomic set by ion or other Alternate feature shape Apply redshift/velocity Capability to load other list (instrument features) ID detected features Export line lists to file 9/25/2024 5
Detections Iterative detection 9/25/2024 6
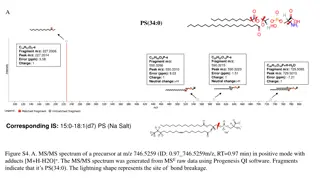
Velocity/redshift 2340 km/s -400 km/s Kaspi et al 2002 reported 2330 km/s Miller et al. 2008 9/25/2024 7
Atomic features So far, taken from xstar database But use of other line lists and models is desired Xstar database has ~105 lines, 432 ions Two lists: From grid of models: find lines from each ion which appear in top 10 in most model top ~800 lines, a few from each ion for use in getting ids Include lines emitted and absorbed, and from fluorescence, recombination, EIE. And physical list generated from physical scenario: photoionization, coronal, nei . Used for evaluating physical scenario via score Wavelengths for strongest lines are known with sufficient accuracy (NIST). Rely on ab initio wavelengths for many inner shell lines; these have fractional errors ~1%, not ideal. Strong lines are almost certainly the same across various line lists 9/25/2024 8
Line identification Using Gaussian fit, line list is searched for all features within either Prescribed energy shift Statistically significant region Subsequent scoring uses sum of all identified model lines satisfying this criterion. Does not pick winners, lets the model choose 9/25/2024 9
Evaluating the physical model Each physical model is very simple: uniform gas with given elemental abundances, or T or age, emission measure If so, line strength depends linearly on abundance, emission measure Evaluate models using a score: Where sum is over lines n is number of lines di is the area of of observed line from Gaussian fit ai is the line strength from model table 0 index is strongest line of each element All the features for a given element are combined into one score makes procedure valid independent of element abundances Look for best score Allows testing of various scenarios Determination of best fit single parameter ( or T or age) 9/25/2024 10
First step load data and calculate continuum position 9/25/2024 11
load line list 9/25/2024 12
load line list with emissivities 9/25/2024 13
Criteria for line detection 9/25/2024 14
Adjust line detection criteria 9/25/2024 15
Choose which identified lines are used in plasma diagnostic 9/25/2024 16
Evaluate plasma diagnostic via score 9/25/2024 17
Possible future tool: Decision tree Final remarks 9/25/2024 18
Next steps Optimize algorithms Manually adding features Experiment with atomic data tailored to specific scenarios Experiment with other algorithms for identifying features. Be more selective according to conditions and atomic data jelle s tree Compare models for similar scenarios across developers Tool will be circulated simultaneously with Hitomi software, but not part of headas 9/25/2024 19