Understanding Infrared Spectroscopy: An Overview of Vibration Energy and Spectral Regions

Infrared spectroscopy involves analyzing absorption spectra resulting from changes in vibration and rotation energy in molecules. The infrared region spans from 0.8 to 200 μm, with distinct zones categorized based on wavenumber and wavelength. Group frequencies and fingerprint regions offer detailed insights into molecular structures and functions, with unique spectral features. Covalent bonds vibrate at different frequencies based on bond strengths and atom masses. Various vibration types, bond trends, and resonance effects contribute to the interpretation of infrared spectra.

Download Presentation

Please find below an Image/Link to download the presentation.
The content on the website is provided AS IS for your information and personal use only. It may not be sold, licensed, or shared on other websites without obtaining consent from the author. Download presentation by click this link. If you encounter any issues during the download, it is possible that the publisher has removed the file from their server.
E N D
Presentation Transcript
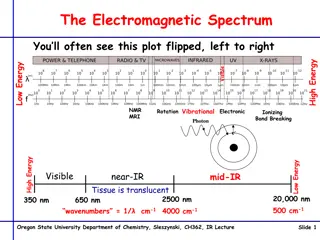
Infrared Spectroscopy Infrared absorption spectra are due to changes in vibration energy accompanied by changes in rotation energy, broadly speaking, the range in the electromagnetic spectrum that extends from (0.8 -200 m) is referred to as the infrared region. In usual practice, however, either the wavelength ( ) or the wavenumber ( =cm 1) is employed to measure the position of a given infrared absorption, more precisely, the infrared regions may be categorized into three distinct zones based on their respective wavenumber and wavelength as stated below: S. No. 1. 2. 3. Region Near I.R. Ordinary I.R. Far I.R. Wavenumber(cm-1) 12500-4000 4000-667 667-50 Wavelength( m) 0.8-2.5 2.5-15 15-200
Infrared Spectroscopy Besides, the infrared region is found to be normally rich in peaks by virtue of the fact that there exist a number of vibration modes (3n-6 for any nonlinear molecule, 3n-5 for any linear molecule, where, n = number of atoms). There are two general regions in the infrared spectrum, namely:- a) Group frequency region:- (2.5-8 m) or (4000-1300cm 1) , the stretching and bending vibration bonds associated with specific structure or functiongroups are observed frequently. Stretching vibration found in Group Frequency Region C H Stretch C = O Stretch S. No. Molecule Wavenumber(cm 1) S. No. Molecule Wavenumber(cm 1) 1 CHCl3 C2H2Cl2 CH2 = CH2 C6H6 CH3OH CH CH 3019 1 CH3COCH3 CH3CHO H5C2COC2H5 HCOOH 1715 2 3089 2 1729 3 3105 2990 3 1720 4 3099 4 1729 5 2977 5 CH3COOH CF3COOH 1718 6 3287 6 1776
Infrared Spectroscopy b) Fingerprint region:- (8.0-25 m)or 1300-400 cm 1 , the vibration modes depend solely and strongly on the rest of the molecule. As we know that no two fingerprints could be identical in human beings, exactly in a similar manner no two compounds may have the same fingerprintregion , thus, each and every molecule essentially gives rise to a unique spectrum which offers a characteristic feature of the same. The vibration frequency may be calculated with fairly remarkable accuracy by the help of Hooke s Law and is expressed as:- Frequency, K Force constant of the bond, m1 and m2 = Masses of two atoms, the reduced mass of the bond system. = = Infrared spectroscopy measures the frequencies of IR light absorbed by a sample and the intensities of the absorptions, the vibration frequencies depend on the nature of the vibration (bending & stretching), bond strengths, and the masses of the atoms involved in the vibration, the intensities depend on the change in dipole moment that accompanies the vibration as well as the number of bonds involved.
INFRA RED SPECTROSCOPY Different covalent bonds have different strengths due to the masses of different atoms at either end of the bond. As a result, the bonds vibrate at different frequencies. The frequency of vibration can be found by detecting when the molecules absorb electro-magnetic radiation. Various types of vibration are possible. stronger bonds have a larger force constant K and vibrate at higher wavenumber. Bonds between atoms of higher mass (larger ) vibrate at lower wavenumber. Trend1 (bond strength): C C (2150 cm-1), C=C (1650 cm-1), C-C (1200cm-1) Trend2(mass):C-H(3000cm-1),C-C(1200cm-1),C-O(1100cm-1),C-Cl(750cm-1), C-Br(600cm-1),C-I(500cm-1). Trend3 (vibration mode) C-H stretching (~3000cm-1)>C-H bending(~1340cm-1) Trend4 (hybridization) K of sp>sp2>sp3 C-H (3300cm-1), =C-H (3100cm-1), -C-H (2900cm-1) Trend5 (resonance) normal ketone (C=O) stretching (1715cm-1), conjugated with C=C (1675~1680cm-1)
INFRA RED SPECTROSCOPY Different covalent bonds have different strengths due to the masses of different atoms at either end of the bond. As a result, the bonds vibrate at different frequencies The frequency of vibration can be found by detecting when the molecules absorb electro-magnetic radiation. Various types of vibration are possible. Examples include... STRETCHING and BENDING SYMMETRIC STRETCHING BENDING ASYMMETRIC STRETCH
BENDING AND STRETCHING IN WATER MOLECULES SYMMETRIC STRETCHING
BENDING AND STRETCHING IN WATER MOLECULES ASYMMETRIC STRETCHING
The Infra-red Spectrophotometer a beam of infra red radiation is passed through the sample a similar beam is passed through the reference cell the frequency of radiation is varied bonds vibrating with a similar frequency absorb the radiation the amount of radiation absorbed by the sample is compared with the reference the results are collected, stored and plotted
The Infra-red Spectrophotometer A bond will absorb radiation of a frequency similar to its vibration(s) normal vibration vibration having absorbed energy
INFRA RED SPECTRA - USES IDENTIFICATION OF PARTICULAR BONDS IN A MOLECULE The presence of bonds such as O-H and C=O within a molecule can be confirmed because they have characteristic peaks in identifiable parts of the spectrum.
INFRA RED SPECTRA - USES IDENTIFICATION OF PARTICULAR BONDS IN A MOLECULE The presence of bonds such as O-H and C=O within a molecule can be confirmed because they have characteristic peaks in identifiable parts of the spectrum. IDENTIFICATION OF COMPOUNDS BY DIRECT COMPARISON OF SPECTRA The only way to completely identify a compound using IR is to compare its spectrum with a known sample. The part of the spectrum known as the Fingerprint Region is unique to each compound.
INFRA RED SPECTRA - INTERPRETATION Infra-red spectra are complex due to the many vibrations in each molecule. Total characterisation of a substance based only on its IR spectrum is almost impossible unless one has computerised data handling facilities for comparison of the obtained spectrum with one in memory. However, the technique is useful when used in conjunction with other methods such as nuclear magnetic resonance (nmr) spectroscopy and mass spectroscopy. Peak position depends on bond strength masses of the atoms joined by the bond strong bonds and light atoms weak bonds and heavy atoms absorb at high wavenumbers absorb at lower wavenumbers
INFRA RED SPECTRA - INTERPRETATION Vertical axis Absorbance the stronger the absorbance the larger the peak Horizontal axis Frequency Wavelength wavenumber (waves per centimetre) / cm-1 microns (m); 1 micron = 1000 nanometres
FINGERPRINT REGION organic molecules have a lot of C-C and C-H bonds within their structure spectra obtained will have peaks in the 1400 cm-1 to 400 cm-1 range this is referred to as the fingerprint region the pattern obtained is characteristic of a particular compound the frequency of any absorption is also affected by adjoining atoms or groups.
IR SPECTRUM OF A CARBONYL COMPOUND carbonyl compounds show a sharp, strong absorption between 1700 and 1760 cm-1 this is due to the presence of the C=O bond
IR SPECTRUM OF AN ALCOHOL alcohols show a broad absorption between 3200 and 3600 cm-1 this is due to the presence of the O-H bond
IR SPECTRUM OF A CARBOXYLIC ACID carboxylic acids show a broad absorption between 3200 and 3600 cm-1 this is due to the presence of the O-H bond they also show a strong absorption around 1700 cm-1 this is due to the presence of the C=O bond
IR SPECTRUM OF AN ALDEHYDE or KETONE esters show a strong absorption between 1750 cm-1 and 1730 cm-1 this is due to the presence of the C=O bond
WHAT IS IT! One can tell the difference between alcohols, aldehydes and carboxylic acids by comparison of their spectra. ALCOHOL O-H STRETCH ALDEHYDE Or KETONE C=O STRETCH O-H STRETCH CARBOXYLIC ACID AND C=O STRETCH
CHARACTERISTIC FREQUENCIES C N N-H C-Cl O-H C=O C-O C-H Aromatic C-C C=C C-C alkanes
CHARACTERISTIC ABSORPTION FREQUENCIES Bond C-H C-C C=C Class of compound Alkane Alkane Alkene Range / cm-1 2965 - 2850 1200 - 700 1680 - 1620 Intensity strong weak variable C=O Ketone Aldehyde Carboxylic acid Ester Amide Alcohol, ester, acid, ether 1725 - 1705 1740 - 1720 1725 - 1700 1750 - 1730 1700 - 1630 1300 - 1000 strong strong strong strong strong strong C-O O-H Alcohol (monomer) Alcohol (H-bonded) Carboxylic acid (H-bonded) 3650 - 3590 3420 - 3200 3300 - 3250 variable, sharp strong, broad variable, broad N-H C N Amine, Amide Nitrile 3500 (approx) 2260 - 2240 medium medium C-X Chloride Bromide Iodide 800 - 600 600 - 500 500 (approx) strong strong strong
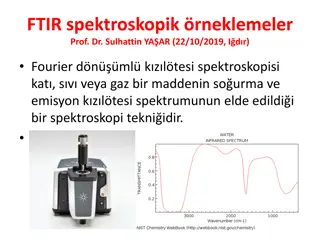
When the frequency of the radiation matches the frequency of a particular vibration, energy is transferred to the molecule, increasing the amplitude of the vibration. One observes the transfer of energy because light equal in energy to the molecular vibration is absorbed from the beam of incident infrared light. The important point is that the energy involved in a vibration is inversely related to the masses of the atoms involved, that is, the heavier the atoms involved, the lower the energy, What are the relating between , and with mass of atom? (H.W.) Determination of IR Spectrum of a Solid Pharmaceutical Substance: (a). Mull Technique: 1. Take about 15-20 mg of sample in a previously cleaned small agate mortar and powder it thoroughly (about 200 mesh). 2. Add to it 2 drops of purified paraffin (Nujol a hydrocarbon liquid, or Flourolube 1370-4000 cm-1) or any liquid and continue the trituration until a very smooth paste of uniform consistency is achieved. 3. Transfer the slurry to a sodium chloride plate, placing it carefully into the cavity made by the spacer, consequently, place the other plate of NaCl on top and thus assemble the cell.
Salient Features: 1. Particle size of the sample has got to be reduced below 200 mesh or 3 m so as to avoid scattering of radiation thereby causing poor absorption spectrum. 2. Hydrogen bonding and crystal forces usually influence the trace obtained. 3.Paraffin itself gives rise to strong band either at 1460-1380 cm 1 or at 2820-2850 cm 1. Clean the salt plates with CCl4 moistened paper towel and dry them with lint-free paper towels after use.
(b).Potassium Bromide Disc Technique:- For a disc of diameter (1-1.3 cm), take 100 mg of spectroscopic grade KBr in a previously cleaned agate pestle and mortar and grind it thoroughly with (0.05- 0.5mg) of the sample, now carefully place the sample mixture into the pressing chamber of the mould in such a manner that it is held between the polished surfaces of the bottom and top pressing dies, finally, enhance the pressing force to 100,000 lb/in2 or 10-12 tons/in2 for a period of 1 minutes, carefully, release the pressure and dismantle the dies, now, remove the disc from the mould and keep it in position onto the sample holder. Salient Features: 1. There exists a possibility of interaction between vibrations of the sample and the potassium bromide lattice. 2. It is considered to be the most suitable method for other screening of very minute quantities of substances being eluted from the columns in Gas Liquid Chromatography (GLC), in actual practice, about 300 mg of the spectroscopic grade KBr is placed in a short column immediately after the detector. Consequently, the solid is powdered, pressed into a disc in the normal procedure and ultimately the absorption spectrum of the trapped substance is studied. 3. It enjoys the advantage of producing spectra absolutely free from any solvent peaks (unlike Mull Technique) and hence it is employed extensively in routine analysis.
Internal Standard for KBr-Disc Technique: In quantitative analysis it is essential to examine absolutely uniform discs of identical weights, to achieve this, known weights of both KBr and analyte are required in the preparation of the KBr-disc and finally from the absorption data a calibration-curve may be obtained, in this process, it is a must to weigh the discs and also to measure their thickness at different points Calibration of Infrared Spectroscopy:- The wavelength (or wavenumber) scale calibration of infrared spectroscopy is usually carried out with the aid of a strip of polystyrene film fixed on a frame; it consists of several sharp absorption bands, the wavelengths of which are known accurately and precisely. Basically, all IR-spectroscopes need to be calibrated periodically as per the specific instructions so as to ascertain their accuracy and precision. http://www.chem.ucla.edu/~webspectra/#Problems


.Potassium Bromide Disc Technique:-")