Understanding Stochastics: Measured Data Analysis and Regression Techniques
Explore the world of stochastics through the analysis of measured data, hypothesis testing, regression techniques, and more. Learn how to interpret measurement errors, determine significance levels, and optimize regression models for better data analysis.

Download Presentation

Please find below an Image/Link to download the presentation.
The content on the website is provided AS IS for your information and personal use only. It may not be sold, licensed, or shared on other websites without obtaining consent from the author. Download presentation by click this link. If you encounter any issues during the download, it is possible that the publisher has removed the file from their server.
E N D
Presentation Transcript
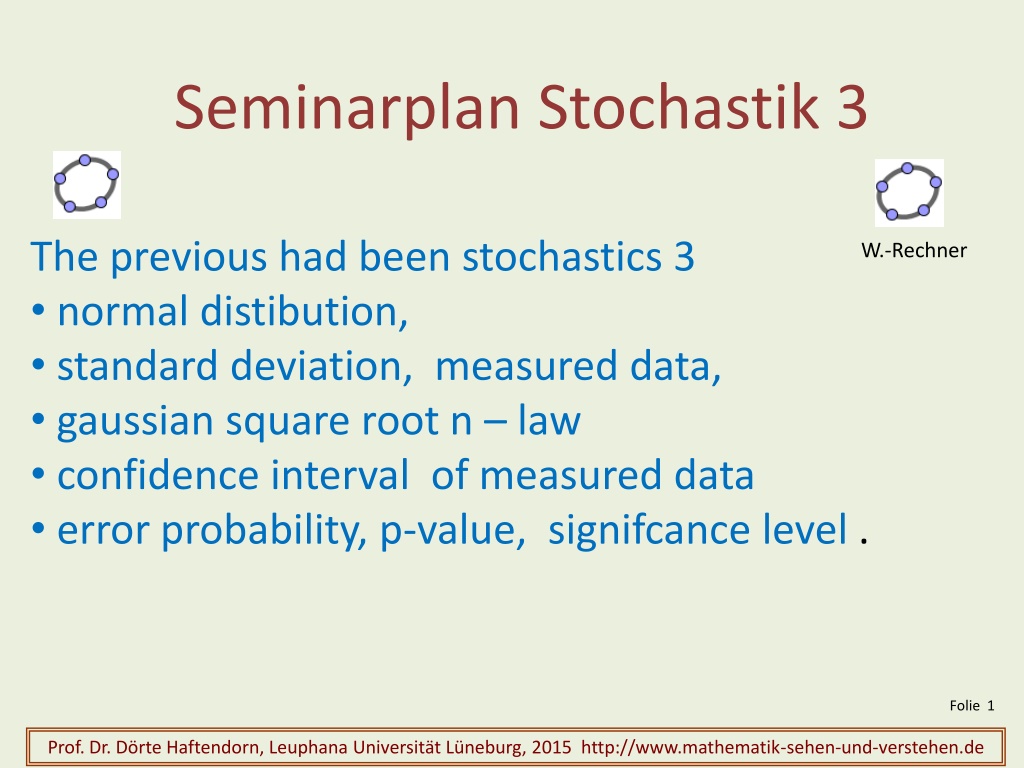
Seminarplan Stochastik 3 geogebra64 geogebra64 The previous had been stochastics 3 normal distibution, standard deviation, measured data, gaussian square root n law confidence interval of measured data error probability, p-value, signifcance level . W.-Rechner Folie 1 Prof. Dr. D rte Haftendorn, Leuphana Universit t L neburg, 2015 http://www.mathematik-sehen-und-verstehen.de
The english translation. Seminarplan Stochastik 4 Overview: How to do stochastics how to write measured data hypothesis testing with measured data regression, correlation elements of descritive statistics more distributions, empirical research geogebra64 W.-Rechner Stochastics is the superordinate concept of descriptive statistics, theorie of probability, infererence statistics www.mathematik-sehen-und-verstehen.de Folie 2 Prof. Dr. D rte Haftendorn, Leuphana Universit t L neburg, 2015 http://www.mathematik-sehen-und-verstehen.de
geogebra64 hypothesis testing with measured values Mathix supposes that his measuring device shows too small values. He planes a measurement with a physical quantity wellknown as 20 mA with sigma=1.6 mA . His result are n=4 values xi={18,19,17,18} mA . Calculate the messured value in the demanded form. Has his measuring device significantly lower values? Demanded are the elements shown on the following side. Folie 3 Prof. Dr. D rte Haftendorn, Leuphana Universit t L neburg, 2015 http://www.mathematik-sehen-und-verstehen.de
geogebra64 hypothesis testing with measured values The test is one sided at the left, because he suppose so befor the measuring. distribution of single values measured value distibution of such means perpetuation region for Ho mean citical region If the mean is in the critical region you must accept H1 and reject H0 standard error Folie 4 If the mean is in the perpetuation region, you cannot accept H1. Nothing is predictable.
Regression geogebra64 Given are measured points. The goal ist best straight line through the point cloud. Shown are in brown the error squares, also called residue squares. In blue is their sum at the left. This must be minimal. Folie 5 Prof. Dr. D rte Haftendorn, Leuphana Universit t L neburg, 2015 http://www.mathematik-sehen-und-verstehen.de
geogebra64 Regression There are two parameters m and k for the line, so the sum of the residue squares is a function of two variables, shown as a 3d-area. The minimal point of this ist the goal. in Optimierung S. 208 ff und Stochastik S. 259 In Excel and GeoGebra this is called trendcurve. Often it is possible to find the regression line with visual judgement. Other regression curves are possible. Folie 6 Prof. Dr. D rte Haftendorn, Leuphana Universit t L neburg, 2015 http://www.mathematik-sehen-und-verstehen.de
The parabolas are the same as shown in 3d-areas. Regression geogebra64 The regression line At the left are the x-variance, y-variance and the mixed variance Folie 7 Prof. Dr. D rte Haftendorn, Leuphana Universit t L neburg, 2015 http://www.mathematik-sehen-und-verstehen.de
Regression, correlation coefficient geogebra64 the standard deviations are correlation coefficient measured points exact on a straight line strong corellation nearly not any correlation strong corellation strong corellation weak correlation r=0.674 r=0.974 r= - 0.968 Folie 8 Prof. Dr. D rte Haftendorn, Leuphana Universit t L neburg, 2015 http://www.mathematik-sehen-und-verstehen.de
desciptive statistics wrong presentaions this is the best, but 2006 must be more at the right. income, men and women Figure b) is wrong because the y-axis begins at 1500 . So it pretends a smaller ratio of the incomes, as it is in reality. Stochastik S. 258 Figure c) is wrong because one cannot see the income of women directly. The figure is able to show the income of families with two erarners. Folie 9 Prof. Dr. D rte Haftendorn, Leuphana Universit t L neburg, 2015 http://www.mathematik-sehen-und-verstehen.de
income, men and women the same as previous desciptive statistics wrong presentaions d) Here are calulated third roots with the values shown in a). If the income is in Euro- coins the cube have exactliy the correct volume. This figure is correct, but the users of excel don t so. Figure e) is wrong because the user of excel has taken the Values shown in a) only as edge length. So the shown volumes are incorrect. Reflect: a cube with the half edge length has only the eighth of the volume. Figure e) is wrong due to the same reason. For the icosahedrons the effect is yet more obvious. Mark: in the sight of science 3d can be risky. Folie 10 Prof. Dr. D rte Haftendorn, Leuphana Universit t L neburg, 2015 http://www.mathematik-sehen-und-verstehen.de
Tables with four cells Four cell test according to Fisher Thera are two groups A and B with a and b elements. There are e elements with the feature E and ne with nE, not E. The table shoes the distibution. Nevertheless there are more cells, but only four inner cells. not for the Klausur e n ea e eb e If the ratio , the other suitable ratios are the same too. Then the groups are not distinctable in respect to E. null hypothesis H0: The groups are not distinctable in respect to E research hypothesis H1: The groups are distinctable in respect to E, group B has significant less E than A (in the upper case). Folie 11 Prof. Dr. D rte Haftendorn, Leuphana Universit t L neburg, 2015 http://www.mathematik-sehen-und-verstehen.de
Vierfeldertafeln not for the Klausur Beispiel A are the students which do the exercises. B are the students which passed the exam. ti-nspire-b-18.png Folie 12 Prof. Dr. D rte Haftendorn, Leuphana Universit t L neburg, 2015 http://www.mathematik-sehen-und-verstehen.de
Vierfeldertafeln Dieses Beispiel hatte ich vorbereitet, musste es dann aber weglassen. Daher ist es nun nicht klausurrelevant. Es ist aber so interessant und wichtig f r Lebenspraxis, dass ich es nicht weglassen m chte. Situation: Mathilde geht zur Vorsorgeuntersuchung. Es geht um eine Krankheit K. Der Test f llt positiv aus, T+. Das hei t aber nicht, dass Mathilde die Krankheit wirklich hat. Wie gro ist die Wahrscheinlichkeit, dass sie trotz T+ gesund ist? T+ T- Bekannt ist die Spezifit t des Testes, die Wahrscheinlichkeit, dass ein Gesunder doch T- erh lt. Das ist P(T-| n K)=94% Damit kann man in dieser Tabelle alle leeren Pl tze f llen. Zuerst den freien Platz rechts 10000-150=9850, dann (n K, T-)=0.94*9850=9259. Der Rest ergibt sich durch Erg nzungen. Dann kann man die Sensitivit t des Testes. T+ T- ausrechnen P(T+| K)=130:150=86,7%, die W., dass ein Kranker T+ bekommt. Mit Sensitivit t und Spezifit t werden richtige Entscheidungen be- schrieben. Mathilde hofft, in dem Feld mit der 591 zu sein, in dem die Gesunden sind, die T+ hatten. not for the Klausur Beispiel aus Sachs,Hedderich:Angewandte Statistik, Springer 2006 S. 135 K 130 150 n K 10000 K 130 20 150 n K 591 9259 9850 721 9279 10000 Die W. f r ein falsch-positves Erg. ist P(K|T+)=591:721=82%. Mathilde wartet mit Gelassenheit auf weitere Tests. Oft denkt man nicht an die Pr valenz P(K)=0.0150. Folie 13 Prof. Dr. D rte Haftendorn, Leuphana Universit t L neburg, 2015 http://www.mathematik-sehen-und-verstehen.de
Data types, types of features nominal, qualitative data color of hairs, religion, country of origin, family status ordinal data, range data your can order reasonable: school grades, grades of comliance score in contests, grades of difficulties in ski-runs, creditpoints metric data, measured data interval data dimensions without a natural zero, i.e. temprature, double is not possible ratio data dimensions with a natural zero, a ratio is meaningful. i.e. mass, length, time, number of successes , double is meaningful metric data are discret or continuous Folie 14 Prof. Dr. D rte Haftendorn, Leuphana Universit t L neburg, 2015 http://www.mathematik-sehen-und-verstehen.de
Benfords distibution https://en.wikipedia.org/wiki/Benford's_law History: In 1881 newcomb discoverd by looking on the logarithmic table book in the libraris, that pages of the lower first digits are more used the others. Newcomb published this and deduced a logarithmic formula. But there was no attention on his work. In 1938 the physicist Frank Benford rediscoverd the law and shows much data for it. It did not proof this. Folie 15 Prof. Dr. D rte Haftendorn, Leuphana Universit t L neburg, 2015 http://www.mathematik-sehen-und-verstehen.de
Benfords distribution Not until 1995 the mathematician Theodore Hill disdovered more and prooved more connections. The mathematician Mark Negrini created an computer program for analysis of data to proof the genuiness of data, which shall be Benford-ditributed . That are mainly data out of exponential contextes, but aggregated data, which are not even benford-didtributed, follows the Benford-distribution. In this way it is possible to discover and proof deception in business und banking data, scientistic data and so on. lg= logatithm with base 10 Benford s law The probabilty that the first digit is x is given by ( 1 lg 1 x = ) P x is first digit + Folie 16 Prof. Dr. D rte Haftendorn, Leuphana Universit t L neburg, 2015 http://www.mathematik-sehen-und-verstehen.de
Seminarplan Stochastik 4 geogebra64 geogebra64 Overview: How to do stochastics regression, korrelation elements of descritive statistics more distributions, empirical research W.-Rechner stochastics is the superordinate concept of descriptive statistics, theorie of probability, infererence statistics www.mathematik-sehen-und-verstehen.de Folie 17 Prof. Dr. D rte Haftendorn, Leuphana Universit t L neburg, 2015 http://www.mathematik-sehen-und-verstehen.de
Stochastik I hope, it had been good for you! Vorlesung in vier Teilen im Rahmen von Mathematik f r alle, Leuphanasemester Folie 18 Prof. Dr. D rte Haftendorn, Leuphana Universit t L neburg, 2015 http://www.mathematik-sehen-und-verstehen.de