Introduction to Statistics: Descriptive and Inferential Methods
Statistics involves collecting, analyzing, and interpreting data to make decisions. It includes descriptive methods to organize data and inferential methods to predict outcomes. Basic terms like elements, variables, and observations are vital in statistical analysis. The total wealth of the world's richest people is presented as an example, illustrating quantitative variables. Understanding these concepts is crucial for studying and applying statistical principles effectively.

Download Presentation

Please find below an Image/Link to download the presentation.
The content on the website is provided AS IS for your information and personal use only. It may not be sold, licensed, or shared on other websites without obtaining consent from the author. Download presentation by click this link. If you encounter any issues during the download, it is possible that the publisher has removed the file from their server.
E N D
Presentation Transcript
Statistics Session 2 Introduction to Statistics II Ezra Halleck, City Tech (CUNY), Fall 2021
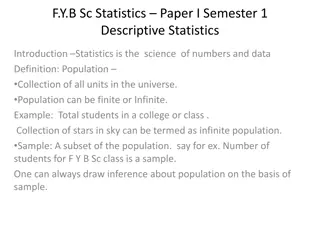
Review: Statistics and Types of Statistics Statistics is the science of collecting, analyzing, presenting, and interpreting data, as well as of making decisions based on such analyses. You can separate into 2 jobs 1. Descriptive: methods for organizing, displaying, and describing data by using tables, graphs, and summary measures. 2. Inferential: methods that use sample results to help make decisions or predictions about a population. 2
1.2 Basic Terms Definition An element or member of a sample or population is a specific subject or object; about which information is collected. For example: a person, firm, item, state, or country. Can you think of other examples of members that might be part of a study? 3
Basic Terms (cont.) Definition A variable is a characteristic under study that assumes different values for different elements. In contrast to a variable, the value of a constant is fixed. Examples of variables could be a person s height, weight, age or health; a firm s earning, financial health, number of employees; a state s education level, poverty index, infrastructure. Come up with variables for your examples of members. 4
Basic Terms (end) Definition The value of a variable for an element is called an observation or measurement. A data set is a collection of observations on one or more variables. A data set is often presented in the form of a spreadsheet (Excel) or a data frame (R). It is not uncommon nowadays to work with datasets with dozens of variables 100 s, 1000 s or even millions of observations. 5
Table 1.1 Total Wealth of the Worlds Ten Richest People (source: Forbes) name net worth age Jeff Bezos $193.5 B 57 Elon Musk $185.7 B 50 Bernard Arnault $177.1 B 72 Mark Zuckerberg $134.0 B 37 Bill Gates $132.1 B 65 Larry Page $123.1 B 48 Sergey Brin $118.8 B 48 Larry Ellison $116.3 B 77 Warren Buffett $103.9 B 91 Steve Ballmer $96.1 B 65 source Amazon Tesla, SpaceX LVMH Facebook Microsoft Google Google software Berkshire Hathaway Microsoft country United States United States France United States United States United States United States United States United States United States 6
Quantitative Variables Definition A variable that can be measured numerically is called a quantitative variable. The data collected on a quantitative variable are called quantitative data. People or other living thing examples: height, weight for; Country, state or other geographical entity: a. portion in poverty, uninsured, underinsured, unemployed, discouraged b. level of income inequality: 90th percentile/10th percentile 7
For wealth table: what are the numeric variables? name net worth age source country Jeff Bezos $193.5 B 57 Amazon United States Elon Musk $185.7 B 50 Tesla, SpaceX United States Bernard Arnault $177.1 B 72 LVMH France Mark Zuckerberg $134.0 B 37 Facebook United States Bill Gates $132.1 B 65 Microsoft United States Larry Page $123.1 B 48 Google United States Sergey Brin $118.8 B 48 Google United States Larry Ellison $116.3 B 77 software United States Warren Buffett $103.9 B 91 Berkshire Hathaway United States Steve Ballmer $96.1 B 65 Microsoft United States Note how one is given with decimals: it is continuous numeric. The other is given as an integer; it is discrete numeric. 8
Discrete vs Continuous Definition A variable whose values are countable is discrete. In other words, a discrete variable can assume only certain values with no intermediate values. A variable that can assume any numerical value over an interval (or intervals) is continuous. Classify the other numeric variables we have discussed: height, weight (if rounded to nearest inch, lb): discrete portion in poverty, etc, income inequality: continuous 9
Qualitative or Categorical Variable Definition A variable that cannot assume a numerical value but can be classified into two or more nonnumeric categories is a qualitative or categorical variable. The data collected on such a variable are called qualitative data. If the variable is a yes or no, then it is binary. If the categories have an intrinsic order, then it is ordinal. Otherwise, it is said to be nominal. Come up with examples each of these subtypes. 10
Figure 1.1 Types of Variables Binary Qualitative or Categorical o Binary (married, not married) o Nominal (color of a car) o Ordinal (education achieved: elementary, high school, etc) Quantitative o Discrete (age in years at previous birthday) o Continuous (height, not rounded) 11
1.4 Cross-Section Versus Time-Series Data Data collected on different elements at the same point in time or for the same period of time are cross-section data. Example is the wealth table (current as of 8/29/21) Data collected on the same element for the same variable at different points in time or for different periods of time are called time-series data. Example is the average tuition and fees on next slide. 12
Table 1.3 Average Tuition and Fees in 2014 Dollars at Four-Year Public Institutions Years Tuition and Fee (Dollars) 1974 75 2469 1984 85 2810 1994 95 4343 2004 05 6448 2014 15 9139 Source: The College Board. 13
1.5 Population Versus Sample Definition A population consists of all elements individuals, items, or objects whose characteristics are being studied. The population on which the study will make conclusions is the target population. The portion of the population selected for actual measurements is referred to as a sample. 14
Population Versus Sample Definition A survey that includes every member of the population is called a census. The technique of collecting information from a portion of the population is called a sample survey. 16
Representative Sample Definition A sample that represents the characteristics of the population as closely as possible is called a representative sample. 17
Random Sample Definition A random sample is a sample drawn in such a way that each member of the population has the same chance of being selected. [Also called a simple random sample.] In a non-random sample, some members of the population may not have any chance of being selected in the sample. 18
Sampling Error Versus Nonsampling Error Definition The sampling error is the difference between the result obtained from a sample survey; the result that would have been obtained if the whole population had been included in the survey. Errors that occur in the collection, recording, and tabulation of data are nonsampling errors or biases. 19
Selection error or bias The sampling is not representative of the population. 21
Nonresponse Error Many of the people included in the sample do not respond to a survey, e.g., not answering a call. 22
Response Error People included in the survey do not provide correct answers, e.g., in regards drug or alcohol consumption. 23
Voluntary Response Error A survey is conducted where people are invited to respond to a questionnaire online. A famous example is the Literary digest who called an election for the Republican Presidential candidate in 1936 when in fact it was easily won by the Democrat (FDR). 24
Non-simple Random Sampling Techniques In a stratified random sample, first divide population into subpopulations (strata): select sample from each of the strata; In cluster sampling: Divide population into (often geographical) groups called clusters; Take a sample of clusters that is representative of the population; [Optional: Take a SRS from each of the selected clusters]. In both cases, the final step is to join all samples into a single set. 25


")
")