StreamNet Executive Committee Meeting Update - Nov. 8, 2016
An update on the StreamNet Executive Committee Meeting held on Nov. 8, 2016, covers various agenda items such as discussions on tribal EPA grants, budget reviews for FY17 and FY16 spending, lessons learned from BPA priority population exercise, and partner budgets for FY17. Details regarding budget allocations, cuts, and concerns for the upcoming financial year were highlighted during the meeting.

Uploaded on Sep 25, 2024 | 0 Views
Download Presentation

Please find below an Image/Link to download the presentation.
The content on the website is provided AS IS for your information and personal use only. It may not be sold, licensed, or shared on other websites without obtaining consent from the author. Download presentation by click this link. If you encounter any issues during the download, it is possible that the publisher has removed the file from their server.
E N D
Presentation Transcript
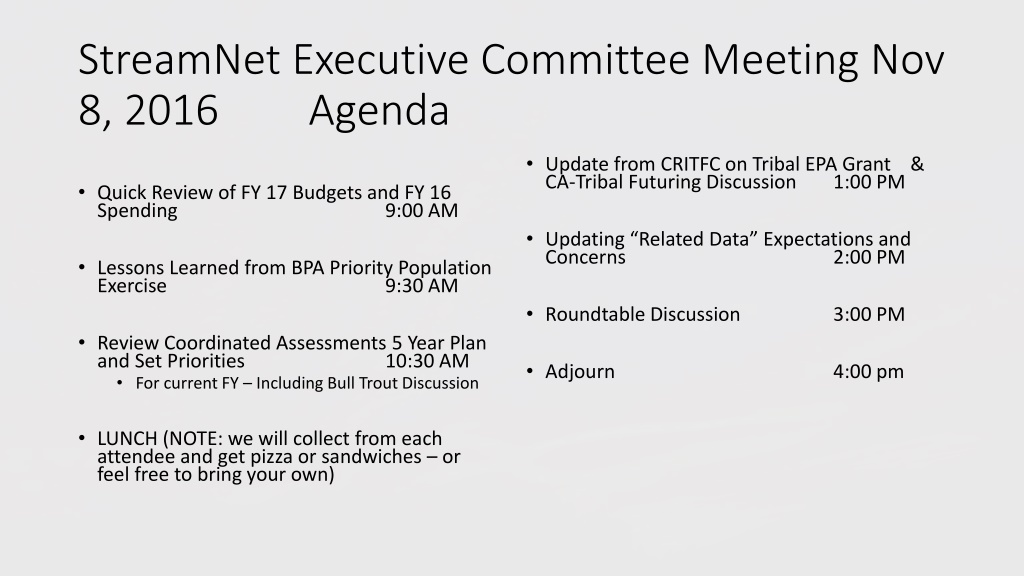
StreamNet Executive Committee Meeting Nov 8, 2016 Agenda Update from CRITFC on Tribal EPA Grant & CA-Tribal Futuring Discussion 1:00 PM Quick Review of FY 17 Budgets and FY 16 Spending 9:00 AM Updating Related Data Expectations and Concerns 2:00 PM Lessons Learned from BPA Priority Population Exercise 9:30 AM Roundtable Discussion 3:00 PM Review Coordinated Assessments 5 Year Plan and Set Priorities For current FY Including Bull Trout Discussion 10:30 AM Adjourn 4:00 pm LUNCH (NOTE: we will collect from each attendee and get pizza or sandwiches or feel free to bring your own)
Quick Review of FY 17 Budgets & Spending FY 2016 Spending target was $49,758 in savings to roll into 17 Total was actually $142,265. As of 11/2/16; PSMFC $51,565 WDFW $19,387 ODFW $23,320 MFWP $35,521 CCT $0 USFWS $0 IDFG $16,472 FY 2017 With savings from 2016 and cuts at PSMFC returned everyone to base
FY 17 Partner Budgets: 2014 2015 2016 2017 CCT $90,000 Partners $1,336,513 $1,456,139 $1,613,402 $1,613,401 IDFG $331,288 MFWP $168,877 PSMFC $647,812 $544,385 $512,053 $470,541 ODFW $474,458 Indirect $100,251 $84,052 $83,596 $111,299* includes Iverson Contract USFWS $78,248 Total $2,084,576 $2,084,576 $2,209,051 $2,195,241 WDFW $470,530
PSMFC & THE 2017 STREAMNET BUDGET WE HAVE REDUCED BPA FUNDING FOR PSMFC STREAMNET PROGRAM (DIRECT ONLY) BY ABOUT 27.4% (-$177,271) IN THE LAST 4 YEARS AND ALLOCATED THAT TO PARTNERS FOR FY 17 WE HAVE ELIMINATED MOST TRAVEL, DEVICE PURCHASES, OTHER EXTRAS (DID ADD A $24,000 SUBCONTRACT FOR TOM IVERSON TO CONTINUE TRIBAL SUPPORT) FOR 2017 THE CUTS AND SHIFTING PSMFC STAFF TO KLAMATH PROJECT WERE USED TO BALANCE THE BUDGET. SHOULD WORK FOR 2017, 2018 WILL HAVE A SIGNIFICANT BUDGET PROBLEM AT PSMFC IF NO INCREASE OR CHANGE
BPA Priority Population Exercise: Lessons Learned CA table Total Populations (excluding Extirpated)* Reported Populations with at least 1 HLI % of Total Populations with an HLI reported % of Populations with no HLIs NOSA 301 138 45.8 54.2 RperS 301 75 24.9 75.1 SAR 301 33 11.0 89 JuvenileOutmigrants 301 25 8.3 91.7 PresmoltAbundance 301 6 2.0 98 *Only TRT populations that are not extirpated or functionally extirpated
BPA Priority Population Exercise: Lessons Learned Coordinated Assessments Data through FY 2016 Number of Populations and Years of Information Reported as of November 3, 2016 IDFG ODFW WDFW CCT CRITFC Indicator All Reported Populations / Years of Info. Populations / Years Populations / Years Populations / Years Populations / Years Populations / Years Natural Origin Spawner Abundance 151 / 4,864 72 / 2,027 20 / 1,070 64 / 1,756 1 / 11 Recruits perSpawner 75 / 2,783 42 / 1,642 18 / 931 15 / 208 1 / 2 Smolt to Adult Ratio 33 / 459 4 / 62 3 / 24 1 / 7 25 / 366 Juvenile Abundance 25 / 389 5 / 91 1 / 21 18 / 268 1 / 9 Presmolt Abundance 6 / 93 4 / 73 2 / 20 Includes estimates coordinated with ISEMP, NPT or SBT. Note: Some numbers don t add up across Indicators Reported due to portions of Populations shared by agencies or multiple RperSTypes reported per Population, etc. Includes TRT, non-TRT Populations and SuperPopulations.
BPA Priority Population Exercise: Lessons Learned Years of data related to FCRPS/BPA Priority # 1 2 3 126 11 345 104 586 1,371 53 114 2 263 432 1,299 7 35 6 14 62 41 9 115 Years Validated CA table Agency ODFW CCT WDFW IDFG All Agencies IDFG WDFW CCT ODFW All Agencies CCT ODFW CRITFC WDFW All Agencies ODFW CCT WDFW IDFG All Agencies ODFW WDFW All Agencies Populations HLIs Null Records Last Updated 72 2,027 2,353 744 1,157 35 Oct 20 2016 9:26 Aug 12 2016 5:07 1,028 Sep 23 2016 2:28 75 Oct 19 2016 6:55 1,138 Oct 20 2016 9:26 111 Sep 23 2016 1:37 1 Sep 23 2016 2:39 Aug 24 2016 4:47 83 Oct 13 2016 2:42 195 Oct 13 2016 2:42 Sep 23 2016 2:42 6 Oct 10 2016 6:55 4 Sep 7 2016 12:14 Sep 23 2016 2:42 10 Oct 10 2016 6:55 7 Oct 10 2016 6:55 Sep 23 2016 2:47 7 Sep 23 2016 2:47 2 Sep 27 2016 4:02 16 Oct 10 2016 6:55 15 Aug 24 2016 4:48 Sep 23 2016 3:20 15 Sep 23 2016 3:20 1 11 11 NOSA 64 20 1,756 1,070 4,864 931 208 728 125 502 1,286 464 2,907 424 1,989 5,081 820 207 NOSA 151 18 15 454 60 RperS 34 1 2 2 42 75 1,642 2,783 1,559 2,588 785 594 1,052 RperS 1 4 7 7 SAR 62 56 11 27 10 48 32 16 25 366 24 459 91 362 24 449 84 333 3 SAR 33 349 18 5 1 Juvenile Outmigrants 9 9 18 268 21 389 73 20 93 261 19 373 58 20 78 56 97 21 1 Juvenile Outmigrants Presmolt Abundance Presmolt Abundance 25 165 41 20 61 88 32 136 4 2 6 32 PNI All Agencies All Tables All Agencies 290 8,588 8,569 1,306 2,838 4,444 1,374 Oct 20 2016 9:26
Our (PSMFC) Priority List for FY 16: 1. HLIs for 18 Tier 1 Populations 2. HLIs for 51 Tier 2 Populations 3. HLIs for other populations 4. Trends for both Tier 1 and Tier 2 Populations 5. Fish Distribution Updates 6. Facilities dataset maintenance 7. NPCC dashboard trends 8. Other (i.e. resident fish data, etc.)
What Did We Learn From This Effort? How Does This Effect Priorities for 2017? Do We Want to Pursue Any Recommendations to Regional Fish & Wildlife Managers? PSMFC Recommendation: Clear direction to your StreamNet-funded staff on priorities is essential
Next Priorities Discussion From the CA 5 Year Plan Year 2 (Oct, 2016 Sep, 2017); Maintain, update, and automate existing data flow. Fully populate all Natural Origin Indicators with data populate with data Finalize DES for hatchery indicators, begin to managers, expand hatchery DES team Coordinate closely with hatchery database regional fish and wildlife managers Align hatchery DES development with needs of
Review of CA 5 Year Plan Set Priorities for FY 17 Add PNI as indicator? Is currently a metric and data is present in many cases (instruct partner staff to report, validate, and publish?) SARs (Coordination with CRITFC and FPC) Hatchery Indicators: A policy-level discussion is needed to define what is needed and useful. StreamNet will try to facilitate a work group that will define what hatchery information should be pursued -- DES work can follow if needed. StreamNet Executive Committee participants will provide names of correct people to invite to this work group (May, 2016 notes). Focus on continuing to populate existing NO Indicators with data? CAPG discussion (primarily your data compilers); project is still very labor intensive, consensus to retain focus on populating, automating, and updating existing NO indicators in FY 17 Move bull trout, lamprey, or other species up the priority list?
SARs Data has been reported by CRITFC & is available at FPC If we want to coordinate, need to decide on which data to report; Mostly hatchery data. Entire year's cohort above the smolt location. Essentially the same as a C.A. superpopulation. Comparative Survival Study is separate SARs for transported, in-river detected, and in-river not detected. Study category for wild fish. Study category for hatchery fish.
Bull Trout Discussion EPA Grant application was dropped, as we were told directly that our ideas for a distribution update and GIS dataset would not qualify as a partnership grant Generally a moderate to high level of interest (depending on agency/individual contacted) in collaboration on bull trout data management in region Did not identify a management/leadership pull for bull trout data (like NOAA 5 year status review) Is there one that we missed? Current CA 5 year plan is to review data on lamprey, sturgeon, and bull trout starting next year (Oct., 2017). Change or update????
Steve Pastor (USFWS) My 2 cents is that this thing has momentum within FWS and this moment should be seized upon. John Arterburn (CCT) No, do not focus on bull trout, but do change the current plan to instead spend more time in the next year on (Write in candidate): Hatchery indicators Evan Brown (IDFG) No, do not focus on bull trout, but do change the current plan to instead spend more time in the next year on (Write in candidate): Lamprey Dawn Anderson (MFW&P) I spoke to our Native Species coordinator in regards to your question to get some additional insight. MT FWP would be somewhere around 3 or 4. We would be a bull trout data supplier however I don t see a critical need to move a bull trout data assessment, critical gap analysis, etc. into this year. Brodie Cox (WDFW) No. Keep bull trout in queue for next year. We are continuing to develop our systems for natural origin salmon indicators and we don't want to change the current 5 year plan. Nancy Leonard (NPCC) Yes I would like to see it raised in priority. MT already has bull trout organized in its database and perhaps that will provide a template for the other managers that gather bull trout data. In general, it would be good to have one resident fish having its data shared in a coordinated manner. I think bull trout is a good one to start with given it is ESA listed. Also provides a resident fish to start having interactions with the managers that we don't normally see in streamnet. a nice test case. Cedric Cooney (ODFW) No. Keep bull trout in queue for next year. o o o o o o o o o
Decision? Current CA 5 year plan is to review data on lamprey, sturgeon, and bull trout starting next year (Oct., 2017). Change or update???? Focus on populating existing Natural Origin Indicators with data? Elevate PNI to indicator ? Work on sharing specific SARs data with CRITFC & FPC? Hatchery data? Bull Trout? Other?+
Update on Tribal EPA Grant & Discussion of Tribal Involvement in CA Project in Future
Updating Related Data Expectations & Concerns Following Table Shows BPA Tier 1 Populations Only
Tier 1 Population Name Agency ODFW ODFW ODFW ODFW ODFW ODFW WDFW WDFW IDFG WDFW WDFW WDFW USFWS WDFW WDFW WDFW WDFW WDFW IDFG Related Data Category Observations Redd Counts Spawner Counts Fish Counts Redd Counts Spawner Counts Fish Counts Redd Counts Hatchery Returns Redd Counts Redd Counts Spawner Abundance Est. Fish Counts Hatchery Returns Redd Counts Spawner Abundance Est. Redd Counts Spawner Counts Spawner Abundance Est. Hatchery Returns Years of Data Catherine Creek - spring Chinook salmon Catherine Creek - spring Chinook salmon Catherine Creek - spring Chinook salmon Grande Ronde River Upper Mainstem - spring Chinook salmon Grande Ronde River Upper Mainstem - spring Chinook salmon Grande Ronde River Upper Mainstem - spring Chinook salmon Tucannon River - spring Chinook salmon Tucannon River - spring Chinook salmon Yankee Fork - spring Chinook salmon Entiat River - spring Chinook salmon Entiat River - spring Chinook salmon Entiat River - spring Chinook salmon Methow River - spring Chinook salmon Methow River - spring Chinook salmon Methow River - spring Chinook salmon Wenatchee River - spring Chinook salmon Wenatchee River - spring Chinook salmon Wenatchee River - spring Chinook salmon South Fork Clearwater River - summer Steelhead Lolo Creek - summer Steelhead Selway River - summer Steelhead Middle Fork Salmon River Lower Mainstem - summer Steelhead Secesh River - summer Steelhead South Fork Salmon River - summer Steelhead Lolo Creek - summer Steelhead Entiat River - summer Steelhead Methow River - summer Steelhead Okanogan River - summer Steelhead Okanogan River - summer Steelhead Okanogan River - summer Steelhead Okanogan River - summer Steelhead Wenatchee River - summer Steelhead Wenatchee River - summer Steelhead 300 404 38 248 341 38 58 23 40 57 14 10 40 219 39 279 133 216 1957-2015 1996-2015 1996-2015 1960-2015 1996-2015 1996-2015 1957-2014 1996-2009 1987-2013 1959-2015 2002-2015 2006-2015 1978-2015 1960-2014 1977-2015 1958-2014 1996-2014 1958-2014 2009-2013 8 WDFW WDFW WDFW WDFW WDFW WDFW WDFW WDFW Redd Counts 10 34 2006-2015 1982-2015 2002-2015 2005-2015 1977-2015 2004-2011 2001-2014 1962-2014 Spawner Abundance Est. Redd Counts Dam / Weir Counts Spawner Abundance Est. Fish Abundance Est. Redd Counts Spawner Abundance Est. 130 10 162 15 235 53
All Agencies Population Related StreamNet Data by Category & Agency Total Datasets Total Data Category IDFG ODFW USFWS WDFW Observations Redd Counts 2,406 8,292 1,445 1,048 12,143 Spawner Counts 6,090 529 663 6,619 Dam / Weir Counts 1,635 109 79 1,744 Spawner Abundance Estimates 235 2,022 77 2,257 Hatchery Returns 120 41 220 58 381 Fish Counts 348 10 21 358 Fish Abundance Estimates 116 15 18 131 Freshwater Harvest 165 18 165 All Related Datasets 2,526 16,716 41 4,515 1,982 23,798
MAY, 2016 EXCOM DISCUSSION; RENAMED TRENDS FOR THE CA DATABASE NOW RELATED DATA IDENTIFIED CATEGORIES TO CARRY FORWARD REDD COUNTS; SPAWNER COUNTS; ESTIMATES OF SPAWNING POPULATION; ESTIMATES OF JUVENILE POPULATION; HATCHERY RETURNS, ETC. DEFINE AND ADOPT DES STANDARDS FOR EACH CATEGORY OF RELATED DATA LOOK AT POPULATIONS AND TRY TO GET CONSISTENCY IN RELATED DATA REPORTED, WHERE POSSIBLE ID LEGACY (I.E. NO LONGER DONE) AND ONGOING RELATED DATA IN CA DATABASE DISPLAY RELATED DATA ON CA WEB INTERFACE LOWER PRIORITY; UPDATING TRADITIONAL TRENDS (KEEP NAME?) IN STREAMNET THAT ARE NOT ASSOCIATED WITH CA
Updating Related Data Expectations & Concerns Issues; significant differences in how partners are updating; data types, amount of data, timelines As we move more into displaying information, discrepancies stand out Legacy datasets that are no longer updated Related data = building blocks that go into HLIs, NOT CA metrics (?) Using existing StreamNet DES standards PSMFC Recommendation: Clear direction to your StreamNet- funded staff on priorities is essential
Coordinated Assessments / Fish Passage Center SAR discussion The SARs envisioned in the Coordinated Assessments DES may not completely match the types of SARs produced by the Fish Passage Center. In the table below is Mike Banach's take on the SARs envisioned by C.A. and what is currently produced by FPC. Aspect / Parameter C.A. FPC Comparison / Discussion Equivalent, though I expect C.A. to be broader list of species. Species Any. Limited to chinook, steelhead, sockeye. Indication of rearing type of fish used to calculate SAR Yes. Yes. Same. Wild fish tagging sites Lower Granite Dam Rocky Reach Dam McNary Dam Bonneville Dam Below Bonneville Dam Equivalent, though I expect C.A. to be broader list of sites. Smolt location Specified in each record. Lower Granite Dam Bonneville Dam Equivalent, though I expect C.A. to be broader of sites. Adult location Specified in each record. Time frame Each record based on outmigration year. Each record based on outmigration year. Same. Field definitions (data dictionary) of data table. Annual report provides detailed methods. Metadata Full methods description. Equivalent. Scope of inference (populations represented) Explicitly defined. Implicit (?) Equivalent ??? Mostly hatchery data. Entire year's cohort above the smolt location. Essentially the same as a C.A. superpopulation. CSS is separate SARs for transported, in- river detected, and in-river not detected. Study category for wild fish. Study category for hatchery fish. FPC has mostly SARs for comparisons of in-river versus transported fish, which is a nongeographic subdivision of populations. By population. "Superpopulations" also possible. Group of fish But they also do "overall" SAR. CSS LGR-LGR is without jacks for transported chinook. Steelhead and sockeye include jacks. C.A. table needs to explicitly tell whether jacks are included. Inclusion of jacks Not specified.
Indication of official TRT method Not equivalent. But are they the same methods anyway? Yes. No. Data status Draft, reviewed, or final. No. FPC provides only final values. Allows for >1 calculation method Yes. ??? ??? Indication of missing adult returns Yes. ??? ??? Explicitly accounted for with NullRecord field. Missing years ??? ??? Confidence limits Yes. Alpha level can be defined. Yes. 90%. Most (all?) of their data are inherently for multiple populations. However they also mostly do SARs for non- geographic divisions of these populations based on in-river versus transported. FPC CI options are more limited. Allows for SARs representing only part of population, or more than the indicated population. These are geographic divisions. Basic incompatibility except for when FPC does overall SAR estimates. PopFit Total smolts (& confidence int.). Total adults (& confidence int.). Exact definition of 'return'. Harvest adjustments. Broodstock removed. In-river juv survival LGR to below Bonn. Number of tagged juvs in a study category. Number of tagged adults returning. Different, due to different purposes. Details
Discussion from 11/3/2016 StreamNet tech group meeting. Expected data delivery for FY2017. Hatchery releases: remove from DES. Marine harvest: remove from DES. Move existing data from the following traditional data categories into the Data Store: hatchery releases, spawner recruit estimates, habitat restoration/improvement projects, pre-built maps (if anything worth saving), photographs (if anything worth saving). Information from Van and others regarding dams and hatcheries in the Fish Facilities Mapper: Van reminded the group that PSMFC created the facilities mapper with a focused goal of providing links to existing fish data collection sites particularly for PSMFC administered projects (including StreamNet, PTAGIS and RMIS). Though limited attributes are exposed on the mapper, the facilities data set does include links to StreamNet data (via HatchID and DamID). PSMFC s GIS Center remains open to feedback on which facilities are included in the data set and displayed in the mapper. PSMFC supports the mapper as a tool focused on the Colombia Basin, but it may expand the data set to support data management for PSMFC projects beyond the Basin. Mike mentioned that some dams that have no data tied to them are biologically very significant -- such as the Lewiston Dam. Jon Bowers said there were many removed dams that are important to know about for such reasons. Van said adding such dams back into the mapper is ok with him, though we may need a protocol for which to include. Leslie always thought the attributes for these tables were a problem anyway, and is happy to see the reduced information in the mapper. Leslie thinks doing state-wide would be easier than just within-Basin. Van agreed, and said PSMFC is willing to accept statewide data for inclusion in the facilities data set, particularly where they are useful for mapping fish data collection locations. Traditional data types that the various organizations expect to do this fiscal year (2017). Jake provided ODFW information after the meeting. Abundance estimates: Spawner abundance estimates -- WDFW. ODFW. Fish abundance estimates -- ODFW. Abundance indexes: Spawner counts -- WDFW. IDFG (carcass counts). ODFW. Dam / weir counts -- ODFW. Maybe others. Redd counts -- WDFW. IDFG. MFW&P. ODFW. Fish counts -- ODFW. Abundance censuses Hatchery returns -- WDFW. IDFG. Freshwater / estuary harvest -- nobody Age data -- IDFG (in association with which data category(ies) was not specified). ODFW (in rare cases). Fish distribution -- WDFW is planning an update this year. IDFG said distribution is only updated in association with a range-wide assessment. Managing distribution and barriers on a regionally standardized routed hydrography is a very large work load that requires coordinated hydrography work that is simply not funded This is the reason StreamNet is moving to allow the xchange of these data as GIS features rather than as events on the hydrography. Trend locations tend to exist on larger streams where the hydrography is and has been relatively stable. We seldom create new trends, so the workload associated with continuing to map Trends to a standardized routed hydrography is manageable. We can revisit this in the future if necessary. Barriers -- More discussion needed higher up for direction. WDFW says their barriers are out of date. It's not a priority for them, and they would have to work closely and extensively with their barriers shop to update this data set. Jon with ODFW suggested maybe barriers could be a GIS layer for the mapper too rather than events on the hydro. If so they could provide many more, and with much less effort. Van agreed with Jon and suggested that, where available, state partners' barrier map services could be added as a map layer in the fish distribution mapper.
Data Store: Data Sets by Fiscal Year (all years) Data Store: Data Sets by Fiscal Year (all years) Fiscal Year Total data sets BPA-funded Data Store: Fiscal Year and Number of Data Sets 2016 10 6 2015 12 6 Total data sets BPA-funded 2014 6 4 30 26 2013 9 8 Total = 111 BPA = 59 25 2012 5 3 2011 13 7 20 2010 7 3 Data Sets 2009 4 2 15 13 12 2008 6 4 10 9 10 2007 7 5 7 7 6 6 6 5 2006 6 3 8 8 4 7 5 6 6 2005 26 8 5 4 4 3 3 3 TOTAL 111 59 2 0 2004 2006 2008 2010 2012 2014 2016 Year
Data Store: Last 5 Fiscal Years by Agency Data Store: Last 5 Fiscal Years by Agency Fiscal Year Agency 2012 2013 2014 2015 2016 TOTAL Columbia River Estuary Study Taskforce 1 1 IDFG 4 4 MFW&P 2 1 2 6 3 14 Nez Perce S&W Cons. Dist. 1 1 1 1 4 NPT 1 1 2 PNNL 1 1 SBT 2 3 3 1 9 StreamNet 1 1 USFWS 1 1 2 USGS 2 2 YIN 1 1 TOTAL 5 9 6 12 9 41


 Priority List for FY 16:")


")


")