StreamNet Steering Committee Meeting Update - Nov 10, 2016
The StreamNet Steering Committee Meeting held on November 10, 2016, covered various agenda items such as budget reviews, lessons learned, data assessments, and future funding considerations. Discussions included updates on tribal grants, budget allocations across partners, budget cuts, and challenges for the upcoming fiscal years. The meeting emphasized the importance of resource allocation in supporting StreamNet's priorities and highlighted the need for transparency in subcontract budgets for better planning. Attendees also discussed the reprogramming of BPA funding to partners, potential budget issues in the future, and plans for budget meetings with partners.

Uploaded on Sep 25, 2024 | 0 Views
Download Presentation

Please find below an Image/Link to download the presentation.
The content on the website is provided AS IS for your information and personal use only. It may not be sold, licensed, or shared on other websites without obtaining consent from the author. Download presentation by click this link. If you encounter any issues during the download, it is possible that the publisher has removed the file from their server.
E N D
Presentation Transcript
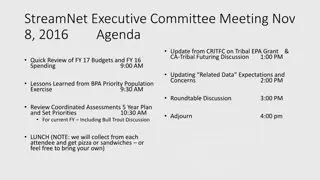
StreamNet Steering Committee Meeting Nov. 10, 2016 Agenda Update from CRITFC on Tribal EPA Grant Futuring Discussion & CA-Tribal 1:00 PM Quick Review of FY 17 Budgets and FY 16 Spending 9:00 AM Updating Related Data Expectations and Concerns 1:30 PM Lessons Learned from BPA Priority Population Exercise 9:30 AM Roundtable Discussion 2:30 PM Review Coordinated Assessments 5 Year Plan and Set Priorities For current FY Including Bull Trout Discussion Roundtable Discussion: Issues with Gathering, Validating, 10:30 AM Adjourn 4:00 pm 11:00 AM And QA/QC ing CA HLI Data LUNCH (NOTE: we will collect from each attendee and get pizza or sandwiches or feel free to bring your own)
Quick Review of FY 17 Budgets & Spending FY 2016 Spending target was $49,758 in savings to roll into 17 Total was actually $142,265. As of 11/2/16; PSMFC $51,565 WDFW $19,387 ODFW $23,320 MFWP $35,521 CCT $0 USFWS $0 IDFG $16,472 FY 2017 With rollover savings from 2016 and cuts at PSMFC returned everyone to base
FY 17 Partner Budgets: 2014 2015 2016 2017 CCT $90,000 Partners $1,336,513 $1,456,139 $1,613,402 $1,613,401 IDFG $331,288 MFWP $168,877 PSMFC $647,812 $544,385 $512,053 $470,541 ODFW $474,458 Indirect $100,251 $84,052 $83,596 $111,299* includes Iverson Contract USFWS $78,248 Total $2,084,576 $2,084,576 $2,209,051 $2,195,241 WDFW $470,530
PSMFC & STREAMNET 2017 BUDGET WE HAVE REPROGRAMMED BPA FUNDING FOR STREAMNET (DIRECT ONLY) AWAY FROM PSMFC ABOUT 27.4% (-$177,271) IN THE LAST 4 YEARS AND ALLOCATED THAT TO PARTNERS HAVE ELIMINATED MOST TRAVEL, DEVICE PURCHASES, OTHER EXTRAS (DID ADD A $24,000 SUBCONTRACT FOR TOM IVERSON TO CONTINUE TRIBAL SUPPORT) FOR 2017 THE CUTS AND SHIFTING PSMFC STAFF TO KLAMATH PROJECT WERE USED TO BALANCE THE BUDGET. SHOULD WORK FOR 2017, 2018 WILL HAVE A SIGNIFICANT BUDGET PROBLEM AT PSMFC IF NO INCREASE OR CHANGE
2017 STREAMNET BUDGET EXECUTIVE COMMITTEE DISCUSSION BPA REQUESTED MORE TRANSPARENCY IN THE SUBCONTRACT BUDGETS. EXPECTATION IS NO ADDITIONAL FUNDING IN 2018 WILL SCHEDULE A BUDGET MEETING THIS WINTER WITH EXCOMM PARTNERS WILL NEED TO DESCRIBE HOW YOUR ALLOCATION OF RESOURCES SUPPORTS THE CURRENT PRIORITIES OF STREAMNET CA PROJECT DISTRIBUTION FACILITIES DATASET
BPA Priority Population Exercise: Lessons Learned Coordinated Assessments Data through FY 2016 Number of Populations and Years of Information Reported as of November 3, 2016 IDFG ODFW WDFW CCT CRITFC Indicator All Reported Populations / Years of Info. Populations / Years Populations / Years Populations / Years Populations / Years Populations / Years Natural Origin Spawner Abundance 151 / 4,864 72 / 2,027 20 / 1,070 64 / 1,756 1 / 11 Recruits perSpawner 75 / 2,783 42 / 1,642 18 / 931 15 / 208 1 / 2 Smolt to Adult Ratio 33 / 459 4 / 62 3 / 24 1 / 7 25 / 366 Juvenile Abundance 25 / 389 5 / 91 1 / 21 18 / 268 1 / 9 Presmolt Abundance 6 / 93 4 / 73 2 / 20 Includes estimates coordinated with ISEMP, NPT or SBT. Note: Some numbers don t add up across Indicators Reported due to portions of Populations shared by agencies or multiple RperSTypes reported per Population, etc. Includes TRT, non-TRT Populations and SuperPopulations.
Our (PSMFC) Priority List for FY 16: 1. HLIs for 18 Tier 1 Populations 2. HLIs for 51 Tier 2 Populations 3. HLIs for other populations 4. Trends for both Tier 1 and Tier 2 Populations 5. Fish Distribution Updates 6. Facilities dataset maintenance 7. NPCC dashboard trends 8. Other (i.e. resident fish data, etc.)
What Did We Learn From This Effort? How Does This Effect Priorities for 2017? Do We Want to Pursue Any Recommendations to Regional Fish & Wildlife Managers? PSMFC Recommendation: Clear direction to your StreamNet-funded staff on priorities is essential
Next Priorities Discussion From the CA 5 Year Plan Year 2 (Oct, 2016 Sep, 2017); Maintain, update, and automate existing data flow. Fully populate all Natural Origin Indicators with data populate with data Finalize DES for hatchery indicators, begin to managers, expand hatchery DES team Coordinate closely with hatchery database regional fish and wildlife managers Align hatchery DES development with needs of
2017 StreamNet Executive Committee Discussion Clear direction on priorities to StreamNet-funded staff is essential Ask partners for report on expected data flow again this year In report, clearly indicate where population level indicator data will not be forthcoming
Review of CA 5 Year Plan Set Priorities for FY 17 Add PNI as indicator? Is currently a metric and data is present in many cases (instruct partner staff to report, validate, and publish?) Hatchery Indicators: A policy-level discussion is needed to define what is needed and useful. StreamNet will try to facilitate a work group that will define what hatchery information should be pursued -- DES work can follow if needed. StreamNet Executive Committee participants will provide names of correct people to invite to this work group (May, 2016 notes). CAPG discussion (primarily your data compilers); CA project is still very labor intensive, consensus appeared to be retain focus on populating, automating, and updating existing NO indicators in FY 17
Bull Trout Discussion EPA Grant application was dropped, as we were told directly that our ideas for a distribution update and GIS dataset would not qualify as a partnership grant Generally a moderate to high level of interest (depending on agency/individual contacted) in collaboration on bull trout data management in region Did not identify a management/leadership pull for bull trout data (like NOAA 5 year status review) Is there one that we missed? Current CA 5 year plan is to review data on lamprey, sturgeon, and bull trout starting next year (Oct., 2017). Change or update????
Streamnet Executive Committee Decision Make populating the existing natural origin indicators the priority for FY 2016 Include discussions with FPC & CRITFC about sharing and displaying SARs for superpopulations Survey partners to get information on predicted dataflow for the year, including information on predicted data, which shows where population level data is not/won t be available Continue to work with CRITFC tribes to include them in data flow to the extent that resources allow them to do so. Nancy Leonard (NPCC), with Chris s help (StreamNet) will convene a Bull trout workshop to identify players, discuss data needs, and identify future paths forward for regional data sharing for this species. Montana will be asked to play an important role (Host?).
Roundtable Discussion: Issues with Gathering, Validating, and QA/QC ing CA HLI Data
Update on Tribal EPA Grant & Discussion of Tribal Involvement in CA Project in Future
Updating Related Data Expectations & Concerns Updating Related Data Expectations & Concerns Following Table Shows BPA Tier 1 Populations Only
Tier 1 Population Name Agency ODFW ODFW ODFW ODFW ODFW ODFW WDFW WDFW IDFG WDFW WDFW WDFW USFWS WDFW WDFW WDFW WDFW WDFW IDFG Related Data Category Observations Redd Counts Spawner Counts Fish Counts Redd Counts Spawner Counts Fish Counts Redd Counts Hatchery Returns Redd Counts Redd Counts Spawner Abundance Est. Fish Counts Hatchery Returns Redd Counts Spawner Abundance Est. Redd Counts Spawner Counts Spawner Abundance Est. Hatchery Returns Years of Data Catherine Creek - spring Chinook salmon Catherine Creek - spring Chinook salmon Catherine Creek - spring Chinook salmon Grande Ronde River Upper Mainstem - spring Chinook salmon Grande Ronde River Upper Mainstem - spring Chinook salmon Grande Ronde River Upper Mainstem - spring Chinook salmon Tucannon River - spring Chinook salmon Tucannon River - spring Chinook salmon Yankee Fork - spring Chinook salmon Entiat River - spring Chinook salmon Entiat River - spring Chinook salmon Entiat River - spring Chinook salmon Methow River - spring Chinook salmon Methow River - spring Chinook salmon Methow River - spring Chinook salmon Wenatchee River - spring Chinook salmon Wenatchee River - spring Chinook salmon Wenatchee River - spring Chinook salmon South Fork Clearwater River - summer Steelhead Lolo Creek - summer Steelhead Selway River - summer Steelhead Middle Fork Salmon River Lower Mainstem - summer Steelhead Secesh River - summer Steelhead South Fork Salmon River - summer Steelhead Lolo Creek - summer Steelhead Entiat River - summer Steelhead Methow River - summer Steelhead Okanogan River - summer Steelhead Okanogan River - summer Steelhead Okanogan River - summer Steelhead Okanogan River - summer Steelhead Wenatchee River - summer Steelhead Wenatchee River - summer Steelhead 300 404 38 248 341 38 58 23 40 57 14 10 40 219 39 279 133 216 1957-2015 1996-2015 1996-2015 1960-2015 1996-2015 1996-2015 1957-2014 1996-2009 1987-2013 1959-2015 2002-2015 2006-2015 1978-2015 1960-2014 1977-2015 1958-2014 1996-2014 1958-2014 2009-2013 8 WDFW WDFW WDFW WDFW WDFW WDFW WDFW WDFW Redd Counts 10 34 2006-2015 1982-2015 2002-2015 2005-2015 1977-2015 2004-2011 2001-2014 1962-2014 Spawner Abundance Est. Redd Counts Dam / Weir Counts Spawner Abundance Est. Fish Abundance Est. Redd Counts Spawner Abundance Est. 130 10 162 15 235 53
All Agencies Population Related StreamNet Data by Category & Agency Total Datasets Total Data Category IDFG ODFW USFWS WDFW Observations Redd Counts 2,406 8,292 1,445 1,048 12,143 Spawner Counts 6,090 529 663 6,619 Dam / Weir Counts 1,635 109 79 1,744 Spawner Abundance Estimates 235 2,022 77 2,257 Hatchery Returns 120 41 220 58 381 Fish Counts 348 10 21 358 Fish Abundance Estimates 116 15 18 131 Freshwater Harvest 165 18 165 All Related Datasets 2,526 16,716 41 4,515 1,982 23,798
MAY, 2016 EXCOM DISCUSSION; RENAME TRENDS FOR THE CA DATABASE RECOMMENDATION TO EXECUTIVE COMMITTEE RELATED DATA IDENTIFY CATEGORIES TO CARRY FORWARD REDD COUNTS; SPAWNER COUNTS; ESTIMATES OF SPAWNING POPULATION; ESTIMATES OF JUVENILE POPULATION; HATCHERY RETURNS, ETC. DEFINE AND ADOPT DES STANDARDS FOR EACH CATEGORY OF RELATED DATA LOOK AT POPULATIONS AND TRY TO GET CONSISTENCY IN RELATED DATA REPORTED, WHERE POSSIBLE ID LEGACY (I.E. NO LONGER DONE) AND ONGOING RELATED DATA IN CA DATABASE DISPLAY RELATED DATA ON CA WEB INTERFACE LOWER PRIORITY; UPDATING TRADITIONAL TRENDS (KEEP NAME?) IN STREAMNET THAT ARE NOT ASSOCIATED WITH CA
UPDATING RELATED DATA EXPECTATIONS & CONCERNS ISSUES; SIGNIFICANT DIFFERENCES IN HOW PARTNERS ARE UPDATING; DATA TYPES, AMOUNT OF DATA, TIMELINES AS WE MOVE MORE INTO DISPLAYING INFORMATION, DISCREPANCIES STAND OUT LEGACY DATASETS THAT ARE NO LONGER UPDATED RELATED DATA = BUILDING BLOCKS THAT GO INTO HLIS, NOT CA METRICS (?) USING EXISTING STREAMNET DES STANDARDS PSMFC RECOMMENDATION: CLEAR DIRECTION TO YOUR STREAMNET-FUNDED STAFF ON PRIORITIES IS ESSENTIAL
UPDATING RELATED DATA EXPECTATIONS & CONCERNS ISSUES; SIGNIFICANT DIFFERENCES IN HOW PARTNERS ARE UPDATING; DATA TYPES, AMOUNT OF DATA, TIMELINES AS WE MOVE MORE INTO DISPLAYING INFORMATION, DISCREPANCIES STAND OUT LEGACY DATASETS THAT ARE NO LONGER UPDATED EXCOM DECISION: CONTINUE COLLECTING AND DISPLAYING THIS DATA AS LONG AS IT S NOT IMPEDING WORK ON HIGHER PRIORITY TASKS DISCUSS WITH PARTNERS AT STEERING COMMITTEE TO MAKE SURE THERE IS COMMON UNDERSTANDING OF WHAT WE ARE ASKING FOR.
BPA Priority Population Exercise: Lessons Learned Years of data related to FCRPS/BPA Priority # 1 2 3 126 11 345 104 586 1,371 53 114 2 263 432 1,299 7 35 6 14 62 41 9 115 Years Validated CA table Agency ODFW CCT WDFW IDFG All Agencies IDFG WDFW CCT ODFW All Agencies CCT ODFW CRITFC WDFW All Agencies ODFW CCT WDFW IDFG All Agencies ODFW WDFW All Agencies Populations HLIs Null Records Last Updated 72 2,027 2,353 744 1,157 35 Oct 20 2016 9:26 Aug 12 2016 5:07 1,028 Sep 23 2016 2:28 75 Oct 19 2016 6:55 1,138 Oct 20 2016 9:26 111 Sep 23 2016 1:37 1 Sep 23 2016 2:39 Aug 24 2016 4:47 83 Oct 13 2016 2:42 195 Oct 13 2016 2:42 Sep 23 2016 2:42 6 Oct 10 2016 6:55 4 Sep 7 2016 12:14 Sep 23 2016 2:42 10 Oct 10 2016 6:55 7 Oct 10 2016 6:55 Sep 23 2016 2:47 7 Sep 23 2016 2:47 2 Sep 27 2016 4:02 16 Oct 10 2016 6:55 15 Aug 24 2016 4:48 Sep 23 2016 3:20 15 Sep 23 2016 3:20 1 11 11 NOSA 64 20 1,756 1,070 4,864 931 208 728 125 502 1,286 464 2,907 424 1,989 5,081 820 207 NOSA 151 18 15 454 60 RperS 34 1 2 2 42 75 1,642 2,783 1,559 2,588 785 594 1,052 RperS 1 4 7 7 SAR 62 56 11 27 10 48 32 16 25 366 24 459 91 362 24 449 84 333 3 SAR 33 349 18 5 1 Juvenile Outmigrants 9 9 18 268 21 389 73 20 93 261 19 373 58 20 78 56 97 21 1 Juvenile Outmigrants Presmolt Abundance Presmolt Abundance 25 165 41 20 61 88 32 136 4 2 6 32 PNI All Agencies All Tables All Agencies 290 8,588 8,569 1,306 2,838 4,444 1,374 Oct 20 2016 9:26
Data Store: Data Sets by Fiscal Year (all years) Data Store: Data Sets by Fiscal Year (all years) Fiscal Year Total data sets BPA-funded Data Store: Fiscal Year and Number of Data Sets 2016 10 6 2015 12 6 Total data sets BPA-funded 2014 6 4 30 26 2013 9 8 Total = 111 BPA = 59 25 2012 5 3 2011 13 7 20 2010 7 3 Data Sets 2009 4 2 15 13 12 2008 6 4 10 9 10 2007 7 5 7 7 6 6 6 5 2006 6 3 8 8 4 7 5 6 6 2005 26 8 5 4 4 3 3 3 TOTAL 111 59 2 0 2004 2006 2008 2010 2012 2014 2016 Year
Data Store: Last 5 Fiscal Years by Agency Data Store: Last 5 Fiscal Years by Agency Fiscal Year Agency 2012 2013 2014 2015 2016 TOTAL Columbia River Estuary Study Taskforce 1 1 IDFG 4 4 MFW&P 2 1 2 6 3 14 Nez Perce S&W Cons. Dist. 1 1 1 1 4 NPT 1 1 2 PNNL 1 1 SBT 2 3 3 1 9 StreamNet 1 1 USFWS 1 1 2 USGS 2 2 YIN 1 1 TOTAL 5 9 6 12 9 41


 Priority List for FY 16:")


")