Understanding ChIP-seq Data Analysis in Primate iPSCs

Analysis of ChIP-seq data in primate iPSCs reveals insights into regulatory differences, experimental systems, read subsampling, QC analysis, peak classification, and cross-species comparisons for transcriptional regulation studies. Balanced designs and functional validation of iPSCs contribute to a comprehensive understanding of genetic regulatory elements in primates.

Download Presentation

Please find below an Image/Link to download the presentation.
The content on the website is provided AS IS for your information and personal use only. It may not be sold, licensed, or shared on other websites without obtaining consent from the author. Download presentation by click this link. If you encounter any issues during the download, it is possible that the publisher has removed the file from their server.
E N D
Presentation Transcript
Yoav Gilad University of Chicago
Transposable elements may not play a major role as drivers of regulatory differences in primates
Transposable elements may not play a major role as drivers of regulatory differences in primates
Experimental system: 10 human + 7 chimp iPSCs 10x 7x Fibroblast-derived H21194 H21792 H20682 H28126 H20961 H28815 C3647 C40280 C40210 C3651 C8861 C3649 C4955 Caucasian F-iPSC LCL-derived 18489 18511 19098 19101 YRI L-iPSC 17 primate iPSC lines RNA-seq H3K9me3 ChIP-seq a mark of transcriptional repression.
Balanced design with respect to all parameters we can think about
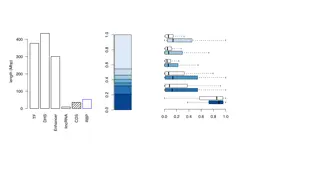
Read subsampling analysis reveals peak # saturation ~ 6 million ChIP , 12 million Input reads
H18489 C3647 H18511 H19098 C3649 H19101 H3K9me3 C3651 H20682 C4955 H20961 C8861 H21194 C40210 H21792 C40280 H28126 H28815 ZNF554 ZNF554 ZNF555 ZNF555
Call peaks in each individual at FDR=0.1 Concatenate lists of all peaks from each species Overlap peaks with orthologous region file (best reciprocal chain hg19-panTro3) Map regions back to original genome Map regions back to reciprocal chain file Orthologous ChIP-seq regions
Most of variation between H3K9me3 ChIP samples explained by species 9 humans + 7 chimps log2 CPM
Proportion of differentially enriched regions using different filtering strategies
Identifying orthologous TEs Generate set of TEs in each genome 5 309 904 hg19 repeatmasker 5 298 130 panTro3 repeatmasker liftOver liftOver 4 838 696 4 886 537 Intersect panTro3rmsk require 50% reciprocal overlap Intersect hg19rmsk require 50% reciprocal overlap 4 583 926 4 551 929 Retain only TEs with same name Retain only TEs with same name 4 261 653 panTro3rmsk_hg19 hg19rmsk_panTro3 4 285 147
Combine TEs from both genomes on human genome panTro3rmsk_hg19 4 261 653 4 285 147 hg19rmsk_panTro3 liftover hg19 hg19rmsk_panTro3_hg19 4 250 677 Intersect reciprocal file 50% overlap 4 250 256 Retain only TEs with same name Orthologous_TEs_human 4 248 188 Ortho TEs hg19 TEs panTro3 TEs
~20% of SVA, ERVK, ERV1 & ERVL-MaLR families marked by H3K9me3 Class Family Type Family Other 780 SVA 7 398 ERVK ERV1 127 525 287 509 LTR ERVL-MaLR 125 997 697 436 358 941 957 972 ERVL L1 L2 Alu MIR LINE SINE 500 317 113 275 TcMar DNA 279 617 hAT
Effect of TE silencing on gene expression levels and divergence
Effect of TE silencing on gene expression levels and divergence
Effect of TE silencing on gene expression levels (B) and divergence (C)


 separate by species")


 and")