Analyzing scRNA-seq Data Using Seurat: Practical Session Overview
Explore the practical steps involved in analyzing single-cell RNA sequencing (scRNA-seq) data with Seurat in this informative session. Learn how to install R and essential packages, download example datasets, understand raw data files, load data into R-Studio, and access data within a Seurat object. Follow along with hands-on instructions to gain insights into gene expression profiling using cutting-edge tools.
Download Presentation

Please find below an Image/Link to download the presentation.
The content on the website is provided AS IS for your information and personal use only. It may not be sold, licensed, or shared on other websites without obtaining consent from the author. Download presentation by click this link. If you encounter any issues during the download, it is possible that the publisher has removed the file from their server.
E N D
Presentation Transcript
Summer Institutes of Statistical Genetics, 2023 SISG Module 6: Gene Expression Profiling Lecture 08: Practical Session for scRNA seq Data Analysis with Seurat Peng Qiu and Greg Gibson Georgia Institute of Technology
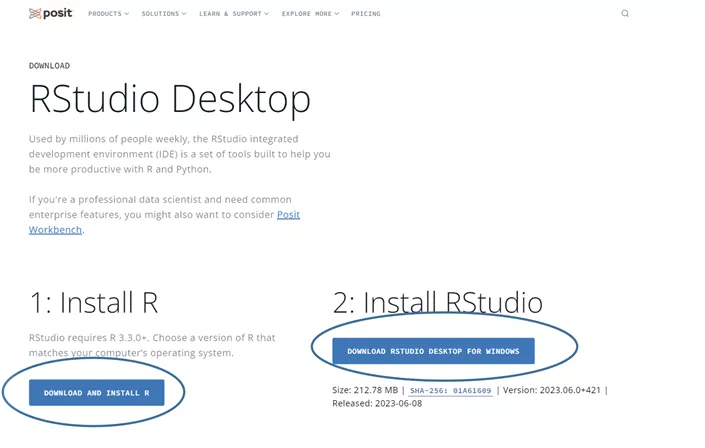
Installing R and R-Studio https://posit.co/products/open-source/rstudio/ <5 minutes <2 minutes
Installing R packages for scRNA-seq analysis Open R-studio and install packages install.packages('Seurat ) install.packages("patchwork") install.packages("dplyr") install.packages("ggplot2") install.packages('hdf5r')
Download an example dataset https://satijalab.org/seurat/articles/pbmc3k_tutorial.html Download pbmc3k dataset Unzip (untar) the downloaded In R-studio, go to the directory of the unzipped data, and set it as working directory
Understand the raw data files Open R-studio Go to Terminal tab Change to directory of raw files cd Desktop/SISG/Lecture\ 08/filtered_gene_bc_matrices/hg19/ Display first few lines of each file $ head -10 barcodes.tsv AAACATACAACCAC-1 AAACATTGAGCTAC-1 AAACATTGATCAGC-1 AAACCGTGCTTCCG-1 AAACCGTGTATGCG-1 AAACGCACTGGTAC-1 AAACGCTGACCAGT-1 AAACGCTGGTTCTT-1 AAACGCTGTAGCCA-1 AAACGCTGTTTCTG-1 $ head -10 genes.tsv ENSG00000243485 MIR1302-10 ENSG00000237613 FAM138A ENSG00000186092 OR4F5 ENSG00000238009 RP11-34P13.7 ENSG00000239945 RP11-34P13.8 ENSG00000237683 AL627309.1 ENSG00000239906 RP11-34P13.14 ENSG00000241599 RP11-34P13.9 ENSG00000228463 AP006222.2 ENSG00000237094 RP4-669L17.10 $ head -10 matrix.mtx %%MatrixMarket matrix coordinate real general % 32738 2700 2286884 32709 1 4 32707 1 1 32706 1 10 32704 1 1 32703 1 5 32702 1 6 32700 1 10
Load raw data Open R-studio, stay in Console tab setwd("C:/Users/pqiu7/Desktop/SISG/Lecture 08") library(dplyr) library(Seurat) library(patchwork) library(ggplot2) raw_data <- Read10X(data.dir = "filtered_gene_bc_matrices/hg19/") obj <- CreateSeuratObject(counts = raw_data, project="pbmc3k", min.cell=3, min.features=200) Try the following and pay attention to the numbers raw_data[1:10, 1:5] raw_data[1:10, 1016:1020] dim(raw_data) obj sum(colSums(raw_data!=0)>=200) sum(rowSums(raw_data!=0)>=3)
Seurat object Try the following to access data in Seurat object obj@meta.data obj@meta.data$nFeature_RNA obj$nFeature_RNA obj@assays$RNA@counts[1:10,1:5] obj@assays$RNA@counts["MS4A1",1:5] obj@assays$RNA@counts[c("MS4A1","CD79B","CD79A"),1:5]
Seurat analysis pipeline QC and select cells obj[["percent.mt"]] <- PercentageFeatureSet(obj, pattern = "^MT-") VlnPlot(obj, features = c("nFeature_RNA", "nCount_RNA", "percent.mt"), ncol = 3) plot1 <- FeatureScatter(obj, feature1 = "nCount_RNA", feature2 = "percent.mt") plot2 <- FeatureScatter(obj, feature1 = "nCount_RNA", feature2 = "nFeature_RNA") plot1 + plot2 obj <- subset(obj, subset = nFeature_RNA > 200 & nFeature_RNA < 2500 & percent.mt < 5) obj (note: 62 cells are filtered out)
Seurat analysis pipeline QC and select cells Normalize data Library size 10000 Log transformation obj <- NormalizeData(obj, normalization.method = "LogNormalize", scale.factor = 10000) obj@assays$RNA@data colSums(exp(obj@assays$RNA@data)-1)
Seurat analysis pipeline QC and select cells Normalize data Library size 10000 Log transformation Select highly variable genes obj <- FindVariableFeatures(obj, selection.method = "vst", nfeatures = 2000) # Identify the 10 most highly variable genes top10 <- head(VariableFeatures(obj), 10) top10 # plot variable features with and without labels plot1 <- VariableFeaturePlot(obj) plot2 <- LabelPoints(plot = plot1, points = top10, repel = TRUE) plot1 + plot2
Seurat analysis pipeline QC and select cells Normalize data Library size 10000 Log transformation Select highly variable genes Scale data all.genes <- rownames(obj) length(all.genes) obj <- ScaleData(obj, features = all.genes) obj@assays$RNA@scale.data obj@assays$RNA@scale.data[1:5,1:5] row_standard_deviation = apply(obj@assays$RNA@scale.data, 1, sd) row_mean <- apply(obj@assays$RNA@scale.data, 1, mean) par(mfrow=c(1,2)) plot(row_mean,row_standard_deviation) plot(row_mean, rowMeans(obj@assays$RNA@counts!=0))
Seurat analysis pipeline obj <- RunPCA(obj, features = VariableFeatures(object = obj)) QC and select cells Normalize data Library size 10000 Log transformation Select highly variable genes Scale data PCA DimPlot(obj, reduction = "pca") # plot(obj@reductions$pca@cell.embeddings[,1], obj@reductions$pca@cell.embeddings[,2]) VizDimLoadings(obj, dims = 1:15, reduction = "pca", ncol = 3) DimHeatmap(obj, dims = 1:15, cells = 500, balanced = TRUE) obj <- JackStraw(obj, num.replicate = 100) obj <- ScoreJackStraw(obj, dims = 1:20) JackStrawPlot(obj, dims = 1:15) ElbowPlot(obj)
Seurat analysis pipeline obj <- FindNeighbors(obj, dims = 1:10) obj <- FindClusters(obj, resolution = 0.5) obj@meta.data[1:10,] QC and select cells Normalize data Library size 10000 Log transformation Select highly variable genes Scale data PCA Clustering + umap obj <- RunUMAP(obj, dims = 1:10) DimPlot(obj, reduction = "umap") cluster3.markers <- FindMarkers(obj, ident.1 = 3, min.pct = 0.25) head(cluster3.markers, n = 5) obj.markers <- FindAllMarkers(obj, only.pos = TRUE, min.pct = 0.25, logfc.threshold = 0.25) obj.markers %>% group_by(cluster) %>% slice_max(n = 2, order_by = avg_log2FC) # A tibble: 18 7 # Groups: cluster [9] p_val avg_log2FC pct.1 pct.2 p_val_adj cluster gene <dbl> <dbl> <dbl> <dbl> <dbl> <fct> <chr> 1 9.57e- 88 1.36 0.447 0.108 1.31e- 83 0 CCR7 2 3.75e-112 1.09 0.912 0.592 5.14e-108 0 LDHB 3 0 5.57 0.996 0.215 0 1 S100A9 4 0 5.48 0.975 0.121 0 1 S100A8 5 1.06e- 86 1.27 0.981 0.643 1.45e- 82 2 LTB 6 2.97e- 58 1.23 0.42 0.111 4.07e- 54 2 AQP3 7 0 4.31 0.936 0.041 0 3 CD79A 8 9.48e-271 3.59 0.622 0.022 1.30e-266 3 TCL1A 9 5.61e-202 3.10 0.983 0.234 7.70e-198 4 CCL5 10 7.25e-165 3.00 0.577 0.055 9.95e-161 4 GZMK 11 3.51e-184 3.31 0.975 0.134 4.82e-180 5 FCGR3A 12 2.03e-125 3.09 1 0.315 2.78e-121 5 LST1 13 3.13e-191 5.32 0.961 0.131 4.30e-187 6 GNLY 14 7.95e-269 4.83 0.961 0.068 1.09e-264 6 GZMB 15 1.48e-220 3.87 0.812 0.011 2.03e-216 7 FCER1A 16 1.67e- 21 2.87 1 0.513 2.28e- 17 7 HLA-DPB1 17 1.92e-102 8.59 1 0.024 2.63e- 98 8 PPBP 18 9.25e-186 7.29 1 0.011 1.27e-181 8 PF4
Seurat analysis pipeline VlnPlot(obj, features = c("MS4A1", "GNLY", "CD3E", "CD14", "FCER1A", "FCGR3A", "LYZ", "PPBP", "CD8A"), group.by = "seurat_clusters", ncol = 3) QC and select cells Normalize data Library size 10000 Log transformation Select highly variable genes Scale data PCA Clustering + umap Marker genes and visualizations FeaturePlot(obj, features = c("MS4A1", "GNLY", "CD3E", "CD14", "FCER1A", "FCGR3A", "LYZ", "PPBP", "CD8A")) DotPlot(obj, features = c("PPBP", "FCER1A", "GNLY", "FCGR3A", "CD8A", "MS4A1", "CD3E", "CD14", "LYZ"), group.by = "seurat_clusters") obj.markers %>% group_by(cluster) %>% top_n(n = 10, wt = avg_log2FC) -> top10 DoHeatmap(obj, features = top10$gene) + NoLegend()
Seurat analysis pipeline new.cluster.ids <- c("Naive CD4 T", "CD14+ Mono", "Memory CD4 T", "B", "CD8 T", "FCGR3A+ Mono", "NK", "DC", "Platelet") QC and select cells Normalize data Library size 10000 Log transformation Select highly variable genes Scale data PCA Clustering + umap Marker genes and visualizations Annotate clusters names(new.cluster.ids) <- levels(obj) obj <- RenameIdents(obj, new.cluster.ids) Idents(obj) DimPlot(obj, reduction = "umap", label = TRUE, pt.size = 0.5) + NoLegend()
Seurat analysis pipeline QC and select cells Normalize data Library size 10000 Log transformation Select highly variable genes Scale data PCA Clustering + umap Marker genes and visualizations Annotate clusters obj2 <- obj levels(obj2@active.ident) <- c(levels(obj2@active.ident),"T + NK") obj2@active.ident[obj2@active.ident=='Naive CD4 T']='T + NK' obj2@active.ident[obj2@active.ident=='Memory CD4 T']='T + NK' obj2@active.ident[obj2@active.ident=='CD8 T']='T + NK' obj2@active.ident[obj2@active.ident=='NK']='T + NK' obj2@active.ident <- droplevels(obj2@active.ident) levels(obj2@active.ident) levels(obj2@active.ident) <- c(levels(obj2@active.ident),"Mono + DC") obj2@active.ident[obj2@active.ident=='FCGR3A+ Mono']='Mono + DC' obj2@active.ident[obj2@active.ident=='CD14+ Mono']='Mono + DC' obj2@active.ident[obj2@active.ident=='DC']='Mono + DC' obj2@active.ident <- droplevels(obj2@active.ident) levels(obj2@active.ident) obj2.markers <- FindAllMarkers(obj2, only.pos = TRUE, min.pct = 0.25, logfc.threshold = 0.25) obj2.markers %>% group_by(cluster) %>% top_n(n = 10, wt = avg_log2FC) -> top10 DoHeatmap(obj2, features = top10$gene) + NoLegend()
Seurat analysis pipeline QC and select cells Normalize data Library size 10000 Log transformation Select highly variable genes Scale data PCA Clustering + umap Marker genes and visualizations Annotate clusters obj3 <- subset(obj, subset = seurat_clusters==1 | seurat_clusters==5 | seurat_clusters==7 ) obj3.markers <- FindAllMarkers(obj3, only.pos = TRUE, min.pct = 0.25, logfc.threshold = 0.25) obj3.markers %>% group_by(cluster) %>% top_n(n = 10, wt = avg_log2FC) -> top10 DoHeatmap(obj3, features = top10$gene) + NoLegend()
Seurat analysis pipeline obj4 <- subset(obj, subset = seurat_clusters==0 | seurat_clusters==2 | seurat_clusters==4 | seurat_clusters==6) QC and select cells Normalize data Library size 10000 Log transformation Select highly variable genes Scale data PCA Clustering + umap Marker genes and visualizations Annotate clusters levels(obj4@active.ident) <- c(levels(obj4@active.ident),"CD4 T") obj4@active.ident[obj4@active.ident=='Naive CD4 T']='CD4 T' obj4@active.ident[obj4@active.ident=='Memory CD4 T']='CD4 T' levels(obj4@active.ident) <- c(levels(obj4@active.ident),"CD8 + NK") obj4@active.ident[obj4@active.ident=='CD8 T']='CD8 + NK' obj4@active.ident[obj4@active.ident=='NK']='CD8 + NK' obj4@active.ident <- droplevels(obj4@active.ident) levels(obj4@active.ident) obj4.markers <- FindAllMarkers(obj4, only.pos = TRUE, min.pct = 0.25, logfc.threshold = 0.25) obj4.markers %>% group_by(cluster) %>% top_n(n = 10, wt = avg_log2FC) -> top10 DoHeatmap(obj4, features = top10$gene) + NoLegend()
Seurat analysis pipeline obj5 <- subset(obj, subset = seurat_clusters==4 | seurat_clusters==6) QC and select cells Normalize data Library size 10000 Log transformation Select highly variable genes Scale data PCA Clustering + umap Marker genes and visualizations Annotate clusters obj5.markers <- FindAllMarkers(obj5, only.pos = TRUE, min.pct = 0.25, logfc.threshold = 0.25) obj5.markers %>% group_by(cluster) %>% top_n(n = 10, wt = avg_log2FC) -> top10 DoHeatmap(obj5, features = top10$gene) + NoLegend() obj6 <- subset(obj, subset = seurat_clusters==0 | seurat_clusters==2) obj6.markers <- FindAllMarkers(obj6, only.pos = TRUE, min.pct = 0.25, logfc.threshold = 0.25) obj6.markers %>% group_by(cluster) %>% top_n(n = 10, wt = avg_log2FC) -> top10 DoHeatmap(obj6, features = top10$gene) + NoLegend()


