Understanding Least Squares Estimation in Global Warming Data Analysis

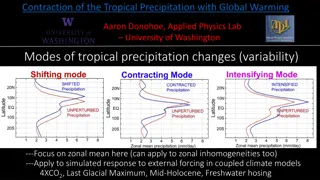
Exploring least squares estimation in the context of global warming data analysis, this content illustrates the process of fitting a curve to observed data points using a simple form of data analysis. It discusses noisy observed data, assumptions, errors, and the importance of model parameters in making accurate predictions. The concept of total error as a measure of goodness-of-fit is highlighted, along with the use of a model formula containing unknown constants to create curves for data analysis.

Download Presentation

Please find below an Image/Link to download the presentation.
The content on the website is provided AS IS for your information and personal use only. It may not be sold, licensed, or shared on other websites without obtaining consent from the author. Download presentation by click this link. If you encounter any issues during the download, it is possible that the publisher has removed the file from their server.
E N D
Presentation Transcript
2023 EESC W3400 Lec 10: Least squares estimation illustrated using global warming data Computational Earth Science Bill Menke, Instructor Emily Glazer, Teaching Assistant TR 2:40 3:55
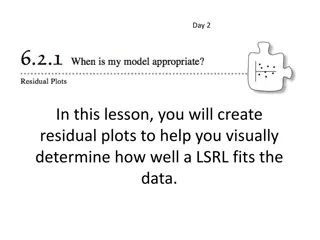
today: curve fitting a simple form of data analysis
??? observed data, ?? data, ? ? time, ? observation time, ??
total of ? data ??? observed data, ?? data, ? ? time, ? observation time, ??
??? is noisy observed data, ?? observation time, ?? is known exactly assumptions: ??? observed data, ?? data, ? ? time, ? observation time, ??
data predicted at same time as observed data ??? predicted data, ?? ??? observed data, ?? data, ? ? time, ? observation time, ??
??? ??? ?? error, ??= ?? ?? data, ? ? time, ? observation time, ??
Not perpendicular distance! ?? No! data, ? ? time, ? observation time, ??
Total error, ? is sum of squares of individual errors is a measure of goodness-of-fit (smaller ?, better fit) ? 2 ? = ?? ?? ?=1 ?4 = ??? ?3 ?2 ?0?1 data, ? ? time, ? observation time, ??
some formula called the model makes this curve ????? = ? ? data, ? ? time, ? observation time, ??
this formula contains ? unknown constants, ?,?,?,? ????? = ? ?,?,?,?,? data, ? ? time, ? observation time, ??
?1 ?2 ?3 ?? ? ? ? ? all these ?unknown constants model parameters , ? = = ????? = ? ?,? data, ? ? time, ? observation time, ??
example: straight line, ? = 2 ????? = ? ?,? = ?0+ ?1? data, ? ? time, ? observation time, ??
Linear Model ????= ?? matrix that may involve the time of observation, but NOT NOT any model parameters
example cubic polynomial ????? = ?0+ ?1? + ?2?2+ ?3?3 3 2 1 1 1 1 ?0 ?1 ?2 ?? ?0 ?1 ?2 ?? ?0 ?1 ?2 ?? ??? ?0 ?1 ?2 3 2 ?0 ?1 ?2 ?2 ??? 3 2 ??? = ??? ?? 2 3 ????= ??
problem use the observed data to determine a best-estimate of the model parameters and some notion of how well they are determined
solution in words the best-estimate ???? of the model parameters is the one that minimizes the total error ? observational error leads to uncertainty of the model parameters
????= ???1?????? mathematic solution ????= ????? ? = ???? ???? always the same so only hard part is setting up G ? = ??? 2= ?/ ? ? ?? 2??? 1 ? = ?? ???= 2 ??? (95% confidence)
????= ???1?????? estimated model parameters ????= ????? GTG = np.matmul( G.T, G); GTd = np.matmul( G.T, dobs); mest = la.solve(GTG,GTd); ? = ???? ???? ? = ??? 2= ?/ ? ? ?? 2??? 1 ? = ?? ???= 2 ??? (95% confidence)
????= ???1?????? ????= ????? predicted data ? = ???? ???? dpre = np.matmul( G, mest); ? = ??? 2= ?/ ? ? ?? 2??? 1 ? = ?? ???= 2 ??? (95% confidence)
????= ???1?????? mathematic solution ????= ????? ? = ???? ???? prediction error e = dobs - dpre; ? = ??? 2= ?/ ? ? ?? 2??? 1 ? = ?? ???= 2 ??? (95% confidence)
????= ???1?????? mathematic solution ????= ????? ? = ???? ???? ? = ??? total error 2= ?/ ? ? E = np.matmul( e.T, e); ?? 2??? 1 ? = ?? ???= 2 ??? (95% confidence)
????= ???1?????? mathematic solution ????= ????? ? = ???? ???? ? = ??? 2= ?/ ? ? ?? Estimated variance of the data 2??? 1 ? = ?? sigmad2 = E/(N-M); ???= 2 ??? (95% confidence)
????= ???1?????? mathematic solution ????= ????? ? = ???? ???? ? = ??? covariance of the model parameters (an MxM matrix) 2= ?/ ? ? ?? 2??? 1 ? = ?? C = sigmad2*la.inv(GTG); ???= 2 ??? (95% confidence)
????= ???1?????? mathematic solution ????= ????? ? = ???? ???? ? = ??? 2= ?/ ? ? ?? 2??? 1 ? = ?? ??? (95% confidence)95% confidence interval of ???= 2 model parameters sm = 2.0*np.sqrt(gda_cvec(np.diag(C)));
Step 1: Get the data from a file as a matrix # get data from file D = np.genfromtxt('test_data.txt', delimiter='\t ); N, i = np.shape(D);
Step 2: identify time and observed-data columns # break out columns of table t = np.copy( D[0:N,0:1] ); dobs = np.copy( D[0:N,1:2] ); # x-axis info tmin = np.min(t); tmax = np.max(t);
Step 3: set up the matrix G (the hard part) # set up cubic polynomial model M = 4; # number of terms in the polynomial # create G G = np.zeros((N,M)); G[0:N,0:1] = np.ones((N,1)); G[0:N,1:2] = t; G[0:N,2:3] = np.power(t,2); G[0:N,3:4] = np.power(t,3); 3 2 1 1 1 1 ?0 ?1 ?2 ?? ?0 ?1 ?2 ?? ?0 ?1 ?2 ?? 3 2 ?= 3 2 3 2
Step 4: compute the least-squares solution # basic least squares GTG = np.matmul(G.T,G); GTd = np.matmul(G.T,dobs); mest = la.solve(GTG,GTd);
Step 5: compute ancillary information # error and confidence limits dpre = np.matmul(G,mest); # prediction e = dobs-dpre; # prediction error sigmad2pos = np.matmul(e.T,e)/(N-M); # data variance Cd = sigmad2pos*la.inv(GTG); # covariance matrix sm = np.sqrt(gda_cvec(np.diag(Cd))); # confidence limits
Step 6: print out the solution and its confidence limits print("estimated standard deviation of the data %.4f % (sqrt(sigmad2pos)) ); print(" "); print("estimated solution"); for i in range(M): print("model parameter %d: %.4f +/- %.4f (95) % (i,mest[i,0],sm[i,0]) );
well determined poorly determined
Step 7: plot the observed and predicted data fig1 = plt.figure(); ax1 = plt.subplot(1,1,1); plt.axis( [tmin, tmax, -4, 4]); #plt.plot(t,dpre,'k-'); plt.plot(t,dobs,'ro'); plt.xlabel('t'); plt.ylabel('d'); plt.title('data: observed (black), predicted (red)'); plt.show();
Step 8: plot the error (at a different scale) fig2 = plt.figure(); ax1 = plt.subplot(1,1,1); absmaxe = np.max(np.abs(e)); plt.axis([tmin,tmax,-2*absmaxe,2*absmaxe]); plt.plot(t,e,'k-'); plt.plot(t,e,'ro'); plt.xlabel('x'); plt.ylabel('e'); plt.title('prediction error'); plt.show();
Group 1: global_temp.txt (years, deg C) how fast is it increasing? Is slope of linear fit positive and significantly different from zero? ? = ? + ?? is it accelerating? Is C in quadratic fit positive and significantly different from zero? ? = ? + ?? + ??2
Group 2: brf_temp.txt (days, deg C) what is the amplitude C of the seasonal cycle? when is the peak ???? of the seasonal cycle? (t=0 is Jan 1, so figure out month) 2? ?? + ?sin 2? ?? ? = ?cos ?2+ ?2 and ? = 365.25 ? = ? 2? ?min _??_???= atan2 ?,?
Group 3: keeling.txt (years, ppm CO2)is it accelerating? Is C in quadratic fit positive and significantly different from zero? ? = ? + ?? + ??2 Compare to fit that accounts for seasonal cycle ? = ? + ?? + ??2 2? ?? + ? sin 2? ?? + ?cos with ? = 1
Group 3: emissionsUSA.txt (years, Mt Carbon) exponential growth is linear when you take the log of the data ? = ?exp ?? In about what year Y does US emissions depart from an exponential growth curve? log ? = log ? + ?? Do a linear fit of log(d) for 1800 through year Y, for a variety of Ys, and see when the posterior standard error of the data starts to get big.


")


")
")
")
is it accelerating?")
")