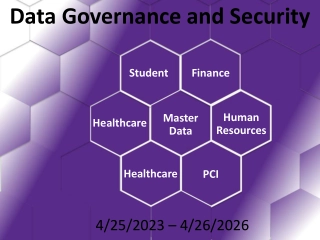
Understanding Data Governance and Data Privacy in Grade XII Data Science

Data governance in Grade XII Data Science Version 1.0 covers aspects like data quality, security, architecture, integration, and storage. Ethical guidelines emphasize integrity, honesty, and accountability in handling data. Data privacy ensures control over personal information collection and sharing. Explore these concepts in chapters focusing on data governance, ethical guidelines, and data privacy.

Download Presentation

Please find below an Image/Link to download the presentation.
The content on the website is provided AS IS for your information and personal use only. It may not be sold, licensed, or shared on other websites without obtaining consent from the author. Download presentation by click this link. If you encounter any issues during the download, it is possible that the publisher has removed the file from their server.
E N D
Presentation Transcript
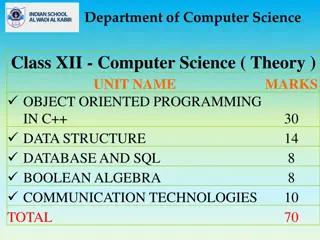
Grade XII Data Science Version 1.0
Chapter 1: Data Governance At the end of this chapter, students should be able to understand: What is data governance? What are the guidelines for the ethical handling of data? What is data privacy?
What is Data Governance? Data governance can be thought of as a collection of people, technologies, processes, and policies that protect and help to manage efficient use of data. Through data governance, we can ensure that the quality and security of the data used is maintained. Data Governance covers the following aspects. Data Quality Data Security Data Architecture Data Integration and Interoperability Data Storage
Ethical Guidelines Ethics can be said to be the moral principles that govern the behavior or actions of an individual or a group. To begin with we must make sure that qualities such as integrity, honesty, objectivity, nondiscrimination are always part of the high-level principles which should be incorporated in all our processes. Software products and data are not always used for purposes which are good for society. Some of the guidelines include the following. Keep the data secure. Be as open and accountable as possible Use technologies that has the minimum intrusion.
Data Privacy Data privacy is the right of any individual to have control over how his or her personal information is collected and used. Data privacy covers the following aspects. How personal data is collected and stored by organizations. Whether and how personal data is shared with third parties. Government policies regarding the storage and sharing of personal information.
Data Privacy Data privacy is not just about secure data storage. There could be cases where personal identifiable information is collected and stored securely in an encrypted format, without any consent from the users regarding the collection of the data itself. In such cases, there is a clear violation of data privacy rules.
Chapter 2: Exploratory Data Analysis This chapter aims the concepts of exploring and cleaning data before performing machine learning operations on it. At the end of this chapter students should be able to understand: Univariate Analysis Multivariate Analysis Data Cleaning Techniques
Univariate analysis can be considered as the easiest form of data analysis where we only analyze only one variable from the entire dataset. Univariate Analysis Since we deal with only one variable, we do not have to worry about causes or relationships. The main purpose of univariate analysis is to describe the data and find patterns that exist within it.
Univariate Analysis Statistical technique Univariate analysis techniques Univariate analysis technique Graphical technique
Univariate Analysis Some statistical methods for univariate analysis include looking at: Mean Median Mode Range Variance Maximum Minimum Quartiles Standard deviation. Use of statistical techniques in univariate analysis
Univariate Analysis Some graphical methods for univariate analysis involve preparing: frequency distribution tables bar charts Histograms frequency polygons pie charts. Use of graphical techniques in univariate analysis
Examples of graphical method for univariate analysis Scatter plot Histogram Boxplot
Bivariate analysis refers to the analysis of two or more variables in the dataset. It is usually carried out between the target variable and another feature of the dataset. Bivariate Analysis The main objective is to find out if there is a relationship between two different variables.
Bivariate Analysis Bivariate analysis is usually done by using graphical methods like scatter plots line charts pair plots. What are the different methods to perform bivariate analysis?
Multivariate analysis is a more complex form of statistical analysis technique and used to analyze more than two variables in the data set. Multivariate Analysis There are several ways to do a multivariate analysis, but it depends on your goals.
Multivariate Analysis Different methods to perform multivariate analysis are: Canonical Correlation Analysis Cluster Analysis Contour plots Principal Component Analysis. What are the different methods to perform multivariate analysis?
Data Cleaning Data cleaning has the following steps. Remove duplicate observations Remove irrelevant observations Remove unwanted outliers Fix data type issues Handle missing data
Chapter 3: Classification Algorithms I This chapter aims at helping students understand concept of Classification with Decision Trees. At the end of this chapter, students should be able to understand: What is a Decision Tree? Applications of Decision Trees How to create a Decision Tree?
Introduction to Decision Trees A decision tree is a diagrammatic representation of the decision-making process and has a tree like structure.
Applications of Decision Trees Decision Trees are one of the best and most used supervised learning methods. Decision Trees are easy to visualize, understand and have a high ease of interpretation. Decision Trees are versatile as they can be used for both classification or regression.
Creating a Decision Tree To create a decision tree, follow the steps below The main objective should be the root of the tree. For each possible decision, stemming from the root make a branch. Finally, you need to calculate the probability of success of each decision being made.
Chapter 4: Classification Algorithms II This chapter aims at helping students understand another important classification algorithm K Nearest Neighbors. At the end of this chapter, students should be able to understand: What is K Nearest Neighbors? Pros and Cons of K-NN What is Cross Validation?
Introduction to K-Nearest Neighbors The K-NN algorithm works on the principal that similar things exist in close proximity to each other.
How K-NN algorithm works Internally, the K-NN algorithm finds the distance between the query point and all the points in the data. It then selects K closest values to the query point and checks the class labels of these K nearest points. It then performs a majority vote to decide the class which is most frequent and outputs that as the predicted class label.
Pros and Cons of using K-NN Pros Cons Simple and Intuitive No Training Step Good for Multi-class problems Slow and memory inefficient Problems with Imbalanced data Sensitive to Outliers
Cross Validation Steps involved in cross validation are as follows. Reserve a small portion of data set called validation data. Test the model on the validation data set and check its accuracy. Train the model using the remaining dataset.
Chapter 5: Regression Algorithms I This chapter aims at to introduce the concepts of regression to the students. By the end of this chapter, students should be able to understand: What is Linear Regression? What is Mean Square Deviation? What is Mean Absolute Error?
Introduction to Linear Regression Linear regression helps to explain the relationship between a variable y given the values of some variable x.
Mean Absolute Error Mean Absolute Error measures the average magnitude of the errors in a set of predictions.
Root Mean Square Deviation The Root Mean Square Deviation is used to determine how close the observed points are to the model s predicted values. Mathematically, the Root Mean Square Deviation is the square root of the variance of the residuals.
Root Mean Square Deviation A small RSME value means that the model is a better fit to the data and thus more accurate. A large RSME value shows that the model is not a good fit and might need to be retrained.
Chapter 6: Regression Algorithms II This chapter aims to dive deeper into regression concepts by teaching students about regression with multiple variables. At the end of this chapter, students should be able to understand: Multiple Linear Regression Non-linear Regression
Multiple Linear Regression Multi-Linear Regression 100000 90000 Multiple Linear Regression uses multiple independent variables to predict the outcome of a dependent variable. 80000 70000 60000 50000 40000 30000 20000 10000 Revenue 0 Investment 1 2 3 4 Year 5 6 0-10000 10000-20000 20000-30000 30000-40000 40000-50000 50000-60000 60000-70000 70000-80000 80000-90000 90000-100000
Income ($) 18000 Non-linear Regression 15,625 16000 14000 12000 The graph of non-linear regression follows equation of a curve. 10000 Income 8000 6000 4000 3,125 2000 625 125 25 5 0 0 1 2 3 4 5 6 7 Month
Chapter 7: Unsupervised Learning This chapter aims at helping students understand concepts of Unsupervised Learning. At the end of this chapter, students should be able to understand: What is Unsupervised Learning? Applications of unsupervised learning What is Clustering? What is k -means Clustering?
Introduction to Unsupervised Learning Unsupervised learning is the process in which the algorithms are not trained using date that is classified or labeled. In unsupervised learning, algorithms act on data without human intervention.
Introduction to Unsupervised Learning Unsupervised learning algorithms discover hidden patterns or data groupings with their ability to discover similarities and differences in information. This makes unsupervised learning algorithms ideal for solving real life problems like exploratory data analysis, customer segmentation, and image recognition.
Real world applications of Unsupervised Learning Recommendation Engines Medical imaging Anomaly detection News Sections Customer personas
Clustering refers to the process of dividing entire raw data into several groups such that the data points in one group are like other data points in the same group but different from those in other groups. Introduction to Clustering Clustering techniques apply when there is no class to be predicted but rather when the instances are to be divided into natural groups.
Introduction to Clustering As shown in the diagram above, the input for a clustering algorithm is the original raw data and the output is a well clustered data set with three distinct clusters.
Introduction to Clustering Partitioning Clustering Density-Based Clustering There are many ways to perform clustering. Here are some of the main clustering methods. Distribution Model-Based Clustering Hierarchical Clustering
K-Means Clustering K-means clustering is an algorithm to classify or to group the objects based on attributes or features into K number of group. K-means algorithm randomly selects centroids, equal to the number of clusters that the user chooses. What is K-Means clustering? The approach the k-means algorithm follows is to solve the problem which is called Expectation-Maximization.
K-Means Clustering The k-means clustering algorithm works is as follows: 1 2 3 4 5 Specify the number of clusters K depending on the input Initialize the centroids by shuffling the data points and then selecting K data points for the centroids randomly. Do iterations till the point that there is no change to the centroids such that the assignment of data points to clusters isn t changing. Compute the sum of the squared distance between data points and all centroids. Classify or mark each data point to the cluster it is closest to.


")