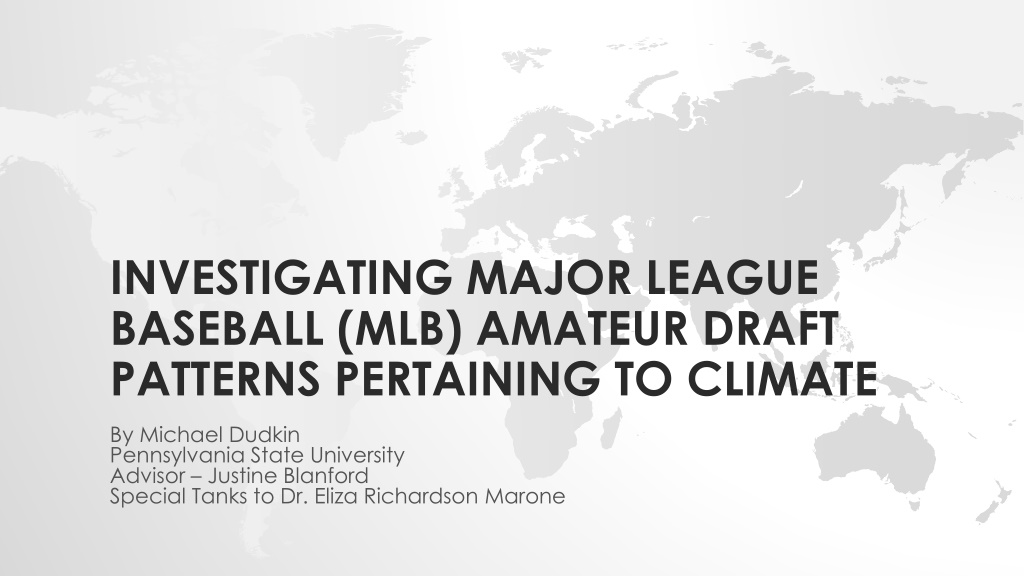
Investigating Major League Baseball (MLB) Amateur Draft Patterns and Player Value
Investigating Major League Baseball (MLB) amateur draft patterns and the value of players in the league. The amateur draft is a key source of cost-controlled talent, allowing clubs to acquire skilled players at a fraction of the cost of free-agent signees. Measuring player value in MLB is often determined by Wins Above Replacement (WAR), a universal framework to evaluate a player's performance relative to replacement-level players. Efficient talent acquisition through the amateur draft is illustrated by examples like Jason Heyward, showing high production compared to salary.

Download Presentation

Please find below an Image/Link to download the presentation.
The content on the website is provided AS IS for your information and personal use only. It may not be sold, licensed, or shared on other websites without obtaining consent from the author. Download presentation by click this link. If you encounter any issues during the download, it is possible that the publisher has removed the file from their server.
E N D
Presentation Transcript
INVESTIGATING MAJOR LEAGUE BASEBALL (MLB) AMATEUR DRAFT PATTERNS PERTAINING TO CLIMATE By Michael Dudkin Pennsylvania State University Advisor Justine Blanford Special Tanks to Dr. Eliza Richardson Marone
TOPIC BACKGROUND MAJOR LEAGUE BASEBALL 2015 total revenue approaching US$9.5 billion 15 consecutive years of revenue growth Increased parity and competition between clubs Amateur draft held every June to bring new talent under contract from US & Puerto Rico (amateur signed from other locations not subject to draft) Amateur draft is major source of cost-controlled talent
AMATEUR DRAFT IS SOURCE OF COST EFFICIENCY Drafted players not eligible for free agency until completion of 6 years service time on MLB roster Drafted players cost-controlled through minimum salaries (1st through 3rdyears) and salary arbitration (next 3 years) Drafted players who excel in MLB provide performance at fraction of cost of free-agent signees who are paid market salaries on multiyear fully-guaranteed contracts
MEASURING PLAYER VALUE IN MAJOR LEAGUE BASEBALL Wins Above Replacement (WAR) A near universal framework within the baseball community to easily summarize a player s value Represents the number of wins a player s performance adds relative to a team composed entirely of replacement players that is, representing a level of performance that can be obtained from any number of available minor league players It sums a player s contributions through all aspects of the game, including value added through batting, baserunning, and defense for hitters and run prevention for pitchers. WAR is a measure of scarcity, and therefore value
WAR SCALE (OVER 162-GAME SEASON) 0 replacement level (good minor leaguer) 1 below average, reserve 2 league average starter 5-7 All-Star level 7-10 MVP level 10+ - historically rare feat
EXAMPLE OF EFFICIENT TALENT ACQUISITION THROUGH AMATEUR DRAFT Production vs salary 2010-2012 Jason Heyward (Atlanta Braves, 2007 draft pick) 14.7 WAR $1,461,500 total salary Carlos Lee (Houston Astros, free agent signee) 1.5 WAR $56,500,000 total salary
RESEARCH QUESTION to investigate if there is any type of spatial bias in selection of amateur draft picks in particular, if there is a cold weather effect in the draft positions of prospects, and if cold-weather state prospects are systemically undervalued by teams. This project will use data points from 30 years of Major League Baseball amateur drafts (1980-2009).
RESEARCH QUESTION (CONT.) This project attempts to reject the null hypothesis that for any given draft slot or range of slots (e.g. picks 1-5, 6-10 and so on from the 1stthrough the 10throunds, the climate associated with a drafted player s school has no bearing on the likelihood that that player will become a viable major league player (as measured by a career Wins Above Replacement of 3 or greater).
QUANTIFYING CLIMATE IMPACTS ON DRAFTABILITY Cold weather prospects face a cold weather bias in baseball industry Such players particularly in heavily populated northeast cannot practice outdoors year round, have a limited schedule, and cannot develop against premier competition in traditional talent hotbed states e.g. TX, FL, CA Scouting players in cold weather climates, particularly high school players, is very challenging just because players play so few games leading up to the draft the fact that 24 selections passed before Mike was drafted does suggest that it is hard to scout in the Northeast. -Matt Klentak, Angels Assistant GM, to USA Today. *http://www.usatoday.com/story/sports/mlb/2014/08/04/mike-trout-salary-production/13347167/
ASSIGNMENT OF DRAFT PICK HOMETOWNS TO CLIMATE CATEGORIES Will use NOAA data to create interpolated climate surface of United States Draft pick hometowns over first 10 rounds in the 30 study years will be mapped to surface and assigned a value That value will be assigned to one of 5 climate categories factoring in temperature and annual rainfall for a given location Will be based on both average temperature and average annual precipitation to better capture effect of limited schedule/practice time, and consequently on quality of competition NOAA 30-year data Initial pilot study used 3 climate categories based on average winter temperature only (based on NOAA 30-year averages)
ADJUSTMENTS TO RAW DATA Once baseline analysis is performed on all players, a subset will be tested This subset will consist only of high-school draftees who are drafted as position players The reason is that the dominant factor in pitcher scouting (throwing velocity) is the variable most independent of geography/climate/competitive environment
EXAMPLE OF CLIMATE DATA USED TO CREATE INTERPOLATED SURFACE Using thousands of data points (each representing avg winter temp) to crate interpolated surface on which draft pick hometowns can be plotted
CONTROL FOR POPULATION Map shows geographic distribution of all draftees 2000- 2009 Map clearly resembles overall US population density map, with major population centers accounting for more data points
CONTROL FOR POPULATION (CONT.) Prior research on talent distribution among pro athletes demonstrates that talent is not proportional to overall population at any given location In particular players from smaller cities and towns are overrepresented in pro sports leagues relative to major urban population centers* ArcGIS mapping tools will be used to create population-corrected visuals to determine overrepresentation effect among MLB draftees, for both the country overall and for warm-weather locations in particular *MACDONALD, DJ; et al. Place but not Date of Birth Influences the Development and Emergence of Athletic Talent in American Football. Journal of Applied Sport Psychology. 21, 1, 80-90, Jan. 2009.
MEASURE OF EXPECTED WAR FROM EACH DRAFT POSITION Value of each draft slot indicated by expected WAR chart crated by baseball researchers who studied what a team can expect over the course of the draft process Due to normal distribution of talent top of 1st round picks are vastly more valuable than subsequent picks
CHI SQUARE ANALYSIS Chi square analysis will quantify differences between observed and expected talent distributions Derived by summing the squared differences between observed and expected frequencies divided by each expected frequency Derived value is compared to corresponding value that would be expected from normal distribution if derived value is higher, null hypothesis can be rejected Threshold used in this study will be at the 95% confidence level
CHI SQUARE ANALYSIS Sample contingency tables from analysis of 1st round draftees 2000-2009 # players Wx_Bin Cold Moderate Warm Grand Total 1 2 3 8 4 5 6 7 Grand Total 17 30 10 57 14 23 13 50 17 17 14 48 17 18 14 49 27 47 25 99 29 39 27 95 129 199 120 448 25 17 50 In this analysis chi-square statistic did not exceed the table value, and H0 could not be rejected Observed Major Leaguers Wx_Bin Cold Moderate Warm Grand Total 1 7 2 8 9 6 3 4 8 5 4 3 4 7 5 9 6 5 6 4 7 Grand Total 4 5 1 10 40 55 36 131 10 8 25 13 5 27 23 17 14 15 This small study divided climate types of draftee hometowns in to very basic Cold/Moderate/Warm bins based on avg winter temperature Expected Major Leaguers Wx_Bin Cold Moderate Warm Grand Total 1 2 3 4 5 6 7 Grand Total 2.6 4.5 1.5 8.6 7.7 12.7 7.2 27.5 7.3 7.3 6.0 20.6 3.3 10.3 7.0 20.5 5.4 5.8 4.5 15.7 6.2 10.8 5.8 22.8 4.4 5.9 4.1 14.3 36.8 57.1 35.9 129.9
SUMMARY CONCLUSIONS FROM PRELIMINARY STUDY H0 cannot be rejected 10 draft years (2000-2009), first round picks ONLY Chi square value to be exceeded 21.026 at p=0.05 Chi square value from study 8.38 Preliminary study (same year/round parameters) but limited to HS draftees only (n=189) H0 cannot be rejected 12.11 chi square value still does not exceed 21.026 at p=0.05
SUMMARY PATHWAY FOR FULL-SCALE STUDY Design 5 concrete climate categories logically consistent with climate and suitability for a baseball environment Create Climate surface using NOAA data Isolate high school hitter draftees from dataset Assign data points into the 5 categories Assign data points intro draft bins (e.g. round 1 picks 1-10..15-20, Round 2, Round 3 and so on) Create expected vs observed contingency tables Calculate chi square value and verify if null hypothesis can be rejected
SELECTED REFERENCES MACDONALD, DJ; et al. Place but not Date of Birth Influences the Development and Emergence of Athletic Talent in American Football. Journal of Applied Sport Psychology. 21, 1, 80-90, Jan. 2009. Draft Index. (n.d.). Retrieved from Baseball-Reference.com: http://www.baseball- reference.com/draft/ Murphy, M. (2014, May 22). The Net Value of Draft Picks. Retrieved from The Hardball Times: http://www.hardballtimes.com/the-net-value-of-draft-picks/ NOAA National Centers for Environmental Information. (2016). Retrieved from 1981- 2010 U.S. Climate Normals: https://www.ncdc.noaa.gov/data-access/land-based- station-data/land-based-datasets/climate-normals/1981-2010-normals-data


")


")