The Effect of Launch Angle and Exit Velocity on Hit Probability in Major League Baseball

Research conducted by Zachary Kellar, Dr. Brandon Koch, and Dr. Anna Panorska from the University of Nevada, Reno focuses on the impact of launch angle and exit velocity on the probability of hit success in Major League Baseball. The study aims to maximize successful outcomes by analyzing the statistical association between these factors and hit probability, utilizing data from the Statcast camera system. Major League Baseball stands to benefit from potential changes in game strategy and player development based on the findings of this research.

Download Presentation

Please find below an Image/Link to download the presentation.
The content on the website is provided AS IS for your information and personal use only. It may not be sold, licensed, or shared on other websites without obtaining consent from the author. Download presentation by click this link. If you encounter any issues during the download, it is possible that the publisher has removed the file from their server.
E N D
Presentation Transcript
The Effect of Launch Angle and Exit Velocity on Hit Probability in Major League Baseball Zachary Kellar | Dr. Brandon Koch* | Dr. Anna Panorska University of Nevada, Reno | Department of Mathematics and Statistics *School of Community Health Sciences
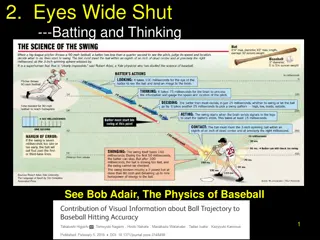
Baseball Introduction 2 American sport between two teams where one team pitches a baseball to an opponent, who attempts to hit the baseball into the field of play Objective of baseball is to score more runs (points) than the opponent This is accomplished by recording base hits For this research, we understand base hits as the desired outcome, or success Our objective is to maximize the probability of successful outcomes
Motivation for Study 3 Major League Baseball is very interested in statistics and quantification of the game Statcast camera system implemented in 2015 Simple tracking of advanced baseball statistics Major League Baseball is interested in the influence of launch angle and exit velocity on the probability of success Launch Angle
Impact of Research 4 Major League Baseball Change in game strategy Alterations in how teams hire, scout, organize, and train players, coaches, and general staff Personal Growth Professional development towards a career in sports statistics Seeking publication of completed work to present to Major League teams, or statistic journals
Scientific Question 5 What is the relationship between launch angle and exit velocity with the probability of success? Our Goal: Find statistical association between launch angle and/or exit velocity, and probability of success Build a model that describes such a relationship Discover what factors beyond launch angle and exit velocity that drive the probability of a successful outcome
The Data 6 New camera-based system introduced in 2015 allows tracking of new variables for each thrown pitch of a season, for every team Extension of 100+ year old database New variables include launch angle, exit velocity, spray angle Statcast Database (2017) 735,817 observations of 79 variables One observation represents a pitch , or possibility of a success Subsetting the Data for our Research Only consider pitches (observations) where ball was hit 129,365 observations composing analysis data set with variables of launch angle, exit velocity, and success/failure
Exploratory Analysis: Launch Angle Distribution 7 Examine the distribution of all observed launch angles in 2017 We observe the launch angle is mostly symmetrically distributed Two frequent observations at -20 and 70
Probability of Success as a Function of Launch Angle 8 Data was divided into 100 categories of equal size from smallest to largest launch angle Percentage of successful outcomes recorded for all 100 intervals was computed Percentiles of launch angle were used for categories to have equal sample sizes for success rate computation We can conclude that the best range of launch angles is between 11.4 and 18 3.9 18 33 -16
Exploratory Analysis: Exit Velocity Distribution 9 Examine the distribution of all observed exit velocities in 2017 We observe that exit velocity is mostly skewed left Frequent observations at 78 and 84 mph
Probability of Success as a Function of Exit Velocity 10 Exploratory distributions were made for exit velocity in the same manner Percentiles of exit velocity were used for categories to have equal sample sizes for success rate computation 76 mph 99.5 mph 84 mph 92.3 mph We observe that larger velocities tend to be more successful
Preliminary Conclusions 11 Launch Angle Relationship with Probability of Success Probability of Success increases as launch angle rises to 11.5 , declines thereafter Best interval of launch angles is (9.8 -15.1 ), where success rate is above 0.7 Exit Velocity Relationship with Probability of Success Upon rising to approximately 90mph, probability of success exhibits linear growth Harder hit baseballs usually lead to more successful outcomes
Probability of Success as a Function of Both Launch Angle and Exit Velocity 12 Relationship between success rate, exit velocity, and launch angle is clear Use both variables to predict success rate, using new bins containing ranges of 10 degrees, and 10 mph respectively Probability of Success Versus Launch Angle and Exit Velocity Exit Velocity Launch Angle We observe that there is a combination of launch angle and exit velocity that produces very high probability of success
Further Database Reduction 13 Extreme probabilities are observed around edges of graph Examine sample sizes as a z-axis, as opposed to success rate Subset data to contain launch angle greater than or equal to 60 , exit velocity greater than or equal to 20 mph Sample Sizes of Created Bins Exit Velocity Launch Angle
General Linear Model 14 Categorize launch angle into 10 intervals, and exit velocity into 4 intervals Response variable is hit (success) indicator Included main effects and interactions in a logistic regression model: log odds of success = a * velocity + b * angle + c * velocity * angle
Model Statistics Training Prediction Accuracy: 79% 15 Training Error: 21% Training: prediction and model fitting is performed on the same data set Note: this accuracy was attained using only two (discretized) variables in the model
Discussion and Conclusions 16 The most successful estimated combination is a launch angle of 15 , and exit velocity of approximately 81 mph Yields success rate of 0.894 Probability of success depends less on launch angle for higher exit velocities Specific launch angles between approximately 8 -15 yield higher success rate estimates Baseballs hit at very low or very high launch angles have very low chances of success
Future Directions 17 Explore probability of success with more variables in the model Spray angle, number of outs Create and compare models with those created from other seasons of Statcast Observe how model relates to older databases that do not possess same scope of information Compare to early 1900 s databases Investigate future seasons of baseball that may be influenced by intentional change of launch angle Currently not controlling variables that would confound the relationship between exit velocity, launch angle, and probability of success Accounted for in future research as more variables are added
References 19 Free Image on Pixabay - Baseball, Field, Sports, Stadium. Baseball Field Sports - Free Vector Graphic on Pixabay, pixabay.com/illustrations/baseball-field-sports-stadium-park-3778774/. Statcast Search CSV Documentation. Baseballsavant.com, baseballsavant.mlb.com/csv-docs. Sheinin, Dave. Why MLB Hitters Are Suddenly Obsessed with Launch Angles. The Washington Post, WP Company, 1 June 2017, www.washingtonpost.com/graphics/sports/mlb-launch-angles- story/?utm_term=.e884252bd08f.