Evolution of Survival Sample Size Methods and Considerations in Survival Analysis

Survival analysis sample size determination is crucial for estimating the expected duration of time to an event accurately. Over time, methods have evolved from simple approximations to more complex models, offering greater flexibility and accuracy in study design. Considerations such as expected survival curves, accrual patterns, dropouts, and crossover subjects must be addressed to ensure robust analysis and interpretation of results. Mistakes can be avoided with the right tools and understanding of the evolving methodologies in survival analysis.

Download Presentation

Please find below an Image/Link to download the presentation.
The content on the website is provided AS IS for your information and personal use only. It may not be sold, licensed, or shared on other websites without obtaining consent from the author. Download presentation by click this link. If you encounter any issues during the download, it is possible that the publisher has removed the file from their server.
E N D
Presentation Transcript
MODULE 3 Survival Analysis (TTE) Sample Size
Sample Size for Survival Analysis Survival Analysis is about the expected duration of time to an event Methods like log-rank test & Cox Model Power is related to the number of events NOT the sample size Sample Size = Subjects to get no. of events Flexibility expected in survival analysis methods and estimation Sample Size methods need to follow suit but can make mistakes easier! Source: SEER, NCI
Evolution of Survival Sample Size Methods General trend is away from simple approximations to more complex model Source: L.S. Freedman (1982) Source: D Schoenfeld,1981 Initial methods based on normal approx. for exponential curves for log-rank test Later methods derived to adjust for unequal follow-up and dropout Source: J.M. Lachin & M.A Foulkes (1986) Complex methods using Markov models or simulation allow greater flexibility Methods for other survival models (Cox, Gehan), trial designs (one sample, >2 samples) and adaptive methods (GSD, SSR) Source: E Lakatos (1988)
Considerations in Survival Sample Size What is the expected survival curve(s) in the group(s)? Assume parametric approximation? Which test appropriate? Effect of unequal follow-up due to accrual period? What accrual pattern to assume? Set max follow-up same for all? How to deal with expected dropouts or censoring? Simple loss-to-followup or integrate dropout process into model? Effect of subjects crossing over from one group to other? Account for at planning stage? How will analysis handle it?
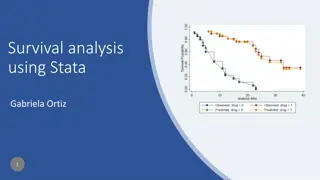
Survival Analysis Example Using an unstratified log-rank test at the one- sided 2.5% significance level, a total of 282 events would allow 92.6% power to demonstrate a 33% risk reduction (hazard ratio for RAD/placebo of about 0.67, as calculated from an anticipated 50% increase in median PFS, from 6 months in placebo arm to 9 months in the RAD001 arm). With a uniform accrual of approximately 23 patients per month over 74 weeks and a minimum follow up of 39 weeks, a total of 352 patients would be required to obtain 282 PFS events, assuming an exponential progression-free survival distribution with a median of 6 months in the Placebo arm and of 9 months in RAD001 arm. With an estimated 10% lost to follow up patients, a total sample size of 392 patients should be randomized. Source: nejm.org Parameter Significance Level (One-Sided) Placebo Median Survival (months) Everolimus Median Survival (months) Hazard Ratio Accrual Period (Weeks) Minimum Follow-Up (Weeks) Power (%) Value 0.025 6 9 0.66667 74 39 92.6
Summary of Survival Sample Size Easy to make mistakes (nQuery will guide/help) Same Time units, parameter conversion, equal follow-up Lots of options and flexibility with survival SSD But each additional option = an additional assumption Can help to have approximation as starting point Useful benchmark and can be tested using simulation NB: Number of Events is the actual target for study After # events reached can stop, N only for planning
nQuery Plans for Survival Analysis More options for fixed term two sample designs More simulation, tests & distributions; piece-wise models etc. Methods for greater than two samples survival designs Omnibus tests, multiplicity methods, conjunctive/disjunctive power Adaptive designs for survival endpoints Improved GSD, SSR (blinded and unblinded), conditional power Bayesian approaches for survival endpoints More assurance options, credible intervals, posterior prob. tests Feedback/Suggestions/Papers for methods very welcome
References Survival Sample Size Freedman, L. S. (1982). Tables of the number of patients required in clinical trials using the logrank test. Statistics in medicine, 1(2), 121-129. Schoenfeld, D. A. (1983). Sample-size formula for the proportional-hazards regression model. Biometrics, 499-503. Lachin, J. M., & Foulkes, M. A. (1986). Evaluation of sample size and power for analyses of survival with allowance for nonuniform patient entry, losses to follow-up, noncompliance, and stratification. Biometrics, 507-519. Lakatos, E. (1988). Sample sizes based on the log-rank statistic in complex clinical trials. Biometrics, 229-241. Yao, J. C., et. al. (2011). Everolimus for advanced pancreatic neuroendocrine tumors. New England Journal of Medicine, 364(6), 514-523.