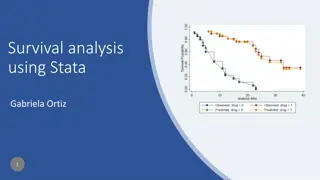
Understanding Survival Analysis: Concepts and Techniques


Lecture 1
1
Survival Analysis –
Part 1
Nina Gunnes
January 21, 2021

01/21/2021

Survival time
•
Time from a
starting point
until an
event of interest
occurs
•
Time from birth to death
•
Duration of marriage
•
Time from treatment to relapse of a specific disease
•
Starting point sometimes harder to define than endpoint
•
When is the actual onset of a disease? Using time of diagnosis instead?
•
Endpoint not necessarily something negative, such as illness or death
•
Can be, e.g., recovery from a disease or spontaneous vaginal delivery
01/21/2021
Lecture 1
2
Survival time, cont.
•
Not always referring to survival in a traditional sense
•
Also known as
time-to-event
data
•
Rarely useful to calculate mean survival time
•
Requires that endpoint actually occurs and is observed for all subjects
•
Survival data rarely normally distributed
•
Survival data analyzed by using special methods
01/21/2021
Lecture 1
3
Censoring
•
Exact time of endpoint not known
•
Event of interest not observed for all subjects at end of study
•
Survival time only
partly
known (e.g., “at least as large as”)
•
Often due to data collected during a limited period of time
•
Three main types
•
Right-censoring
•
Left-censoring
•
Interval-censoring
01/21/2021
Lecture 1
4
Censoring, cont.
•
Right-censoring due to
study termination
or
loss to follow-up
•
Several possible reasons for being lost to follow-up
•
Not responding to questionnaires or attending scheduled hospital visits
•
Study withdrawal
•
Moving or emigration
•
Death (by a cause other than that being studied)
•
A common phenomenon
•
Routinely handled in survival analysis
01/21/2021
Lecture 1
5
Censoring, cont.
01/21/2021
Lecture 1
6
Observation time
Start of study
End
of study
0 years
2
years
4
years
6
years
8
years
Study participant 1
Study participant 2
Study participant 3
Study participant 4
Study participant 5
Study participant 6
Event of interest
Right-censoring
Survival curves
•
Survival data useful to answer important questions
•
Do people live longer today than 50 years ago?
•
Has treatment of breast cancer improved with respect to survival?
•
Do patients live longer after treatment with a new drug?
•
Results from survival studies often presented by survival curves
•
Displaying the proportion of subjects still “alive” after a certain time
•
Starting at 1 (or 100%) since all subjects are “alive” at the starting point
•
Declining towards 0 as more and more subjects reach the endpoint
01/21/2021
Lecture 1
7
Survival curves, cont.
01/21/2021
Lecture 1
8
Survival curves, cont.
01/21/2021
Lecture 1
9
Median survival time
•
Important statistic for survival data
•
Time at which at least 50% of the subjects have “died”
•
Can be read from the survival curve
•
Drawing a straight horizontal line from the 0.5 (50%) mark on the
y
axis
•
Finding the point on the
x
axis where the line crosses the survival curve
•
Inspecting the survival curves for men and women
•
Curve for women above curve for men
•
Higher median survival time for women than for men
01/21/2021
Lecture 1
10
Median survival time, cont.
01/21/2021
Lecture 1
11
Median survival time, cont.
01/21/2021
Lecture 1
12
Kaplan-Meier plot
•
Survival curves constructed by using the Kaplan-Meier method
•
Calculating the survival probability at each observed endpoint
•
Considering an example of malignant melanoma
•
Survival data on 16 patients who have undergone surgery
•
Observation time (i.e., time from surgery to death or censoring)
•
Status at the end of observation time: 1 – dead, 0 – alive (censored)
•
Number of patients alive and under observation
right before
observation time
•
Survival probability
01/21/2021
Lecture 1
13
Kaplan-Meier plot, cont.
01/21/2021
Lecture 1
14
Based on Table 13.1 in Aalen et al. (2006)
Kaplan-Meier plot, cont.
01/21/2021
Lecture 1
15
Kaplan-Meier plot, cont.
01/21/2021
Lecture 1
16
Kaplan-Meier plot, cont.
01/21/2021
Lecture 1
17
Kaplan-Meier plot, cont.
01/21/2021
Lecture 1
18
Kaplan-Meier plot, cont.
01/21/2021
Lecture 1
19
Kaplan-Meier plot, cont.
01/21/2021
Lecture 1
20
Kaplan-Meier plot, cont.
•
Based on some assumptions
•
Independent survival times
•
Starting point and endpoint clearly defined and not changing during the study
•
Life expectancy not changing too much during the study
•
Censoring and endpoint independent of each other
•
Dependent censoring if censoring depends on survival time
•
Illustrated by studying how long you can ride a carousel without throwing up
01/21/2021
Lecture 1
21
Log-rank test
01/21/2021
Lecture 1
22
Log-rank test, cont.
01/21/2021
Lecture 1
23
Log-rank test, cont.
01/21/2021
Lecture 1
24
Example: Primary biliary cirrhosis
•
Considering data from a study on primary biliary cirrhosis
•
312 patients diagnosed with cirrhosis
•
Referral to Mayo Clinic between January 1974 and May 1984
•
Patients randomized to one of two groups
•
DPCA (D-penicillamine)
•
Placebo
•
Patients followed until death or censoring
•
End of follow-up in July 1986
01/21/2021
Lecture 1
25
Example: Primary biliary cirrhosis, cont.
•
125 patients dead by the end of follow-up
•
65 patients in the DPCA group
•
60 patients in the placebo group
•
Study described in Chapter 3 of the book by Laake et al. (2007)
•
Data available at
https://www.med.uio.no/imb/personer/vit/veierod/boker/epidemiol
ogiske-og-kliniske-forskningsmetoder/datafiler/
01/21/2021
Lecture 1
26
Example: Primary biliary cirrhosis, cont.
01/21/2021
Lecture 1
27
Example: Primary biliary cirrhosis, cont.
01/21/2021
Lecture 1
28
Example: Primary biliary cirrhosis, cont.
01/21/2021
Lecture 1
29
References
•
Aalen OO, Frigessi A, Moger TA, Scheel I, Skovlund E, Veierød MB.
Statistiske metoder i medisin og helsefag
. Oslo: Gyldendal akademisk;
2006.
•
Laake P, Hjartåker A, Thelle DS, Veierød MB.
Epidemiologiske og
kliniske forskningsmetoder
. Oslo: Gyldendal akademisk; 2007.
https://www.med.uio.no/imb/forskning/publikasjoner/boker/2007/e
pidemiolgiske-kliniske-forskningsmetoder.html
.
Lecture 1
30
01/21/2021
Survival analysis involves studying the time until an event of interest occurs, like death or relapse of a disease. It explores how different factors affect survival time and uses special methods for analysis. Censoring is a common issue where the exact endpoint time is unknown due to subjects being lost to follow-up or the study terminating. Survival curves help answer critical questions about changes in survival rates over time for various events.

Download Presentation

Please find below an Image/Link to download the presentation.
The content on the website is provided AS IS for your information and personal use only. It may not be sold, licensed, or shared on other websites without obtaining consent from the author. Download presentation by click this link. If you encounter any issues during the download, it is possible that the publisher has removed the file from their server.
E N D
Presentation Transcript
Survival Analysis Part 1 Nina Gunnes January 21, 2021 01/21/2021 Lecture 1 1
Survival time Time from a starting point until an event of interest occurs Time from birth to death Duration of marriage Time from treatment to relapse of a specific disease Starting point sometimes harder to define than endpoint When is the actual onset of a disease? Using time of diagnosis instead? Endpoint not necessarily something negative, such as illness or death Can be, e.g., recovery from a disease or spontaneous vaginal delivery 01/21/2021 Lecture 1 2
Survival time, cont. Not always referring to survival in a traditional sense Also known as time-to-event data Rarely useful to calculate mean survival time Requires that endpoint actually occurs and is observed for all subjects Survival data rarely normally distributed Survival data analyzed by using special methods 01/21/2021 Lecture 1 3
Censoring Exact time of endpoint not known Event of interest not observed for all subjects at end of study Survival time only partly known (e.g., at least as large as ) Often due to data collected during a limited period of time Three main types Right-censoring Left-censoring Interval-censoring 01/21/2021 Lecture 1 4
Censoring, cont. Right-censoring due to study termination or loss to follow-up Several possible reasons for being lost to follow-up Not responding to questionnaires or attending scheduled hospital visits Study withdrawal Moving or emigration Death (by a cause other than that being studied) A common phenomenon Routinely handled in survival analysis 01/21/2021 Lecture 1 5
Censoring, cont. Study participant 1 Event of interest Study participant 2 Right-censoring Study participant 3 Study participant 4 Study participant 5 Study participant 6 0 years 2 years 4 years 6 years 8 years Start of study End of study Observation time 01/21/2021 Lecture 1 6
Survival curves Survival data useful to answer important questions Do people live longer today than 50 years ago? Has treatment of breast cancer improved with respect to survival? Do patients live longer after treatment with a new drug? Results from survival studies often presented by survival curves Displaying the proportion of subjects still alive after a certain time Starting at 1 (or 100%) since all subjects are alive at the starting point Declining towards 0 as more and more subjects reach the endpoint 01/21/2021 Lecture 1 7
Survival curves, cont. 01/21/2021 Lecture 1 8
Survival curves, cont. 01/21/2021 Lecture 1 9
Median survival time Important statistic for survival data Time at which at least 50% of the subjects have died Can be read from the survival curve Drawing a straight horizontal line from the 0.5 (50%) mark on the y axis Finding the point on the x axis where the line crosses the survival curve Inspecting the survival curves for men and women Curve for women above curve for men Higher median survival time for women than for men 01/21/2021 Lecture 1 10
Median survival time, cont. 01/21/2021 Lecture 1 11
Median survival time, cont. 01/21/2021 Lecture 1 12
Kaplan-Meier plot Survival curves constructed by using the Kaplan-Meier method Calculating the survival probability at each observed endpoint Considering an example of malignant melanoma Survival data on 16 patients who have undergone surgery Observation time (i.e., time from surgery to death or censoring) Status at the end of observation time: 1 dead, 0 alive (censored) Number of patients alive and under observation right before observation time Survival probability 01/21/2021 Lecture 1 13
Kaplan-Meier plot, cont. Observation time (in years) Status Number alive and under observation Survival probability 0.10 0 16 1.0 0.64 1 15 0.933 0.97 0 14 1.81 1 13 0.862 2.35 1 12 0.790 2.65 1 11 0.718 2.69 1 10 0.646 3.59 1 9 0.574 4.44 1 8 0.503 4.60 0 7 4.63 1 6 0.419 4.90 0 5 5.32 0 4 5.76 0 3 6.18 1 2 0.209 6.83 0 1 Based on Table 13.1 in Aalen et al. (2006) 01/21/2021 Lecture 1 14
Kaplan-Meier plot, cont. Survival curve starting at 1 at time 0 Survival curve remaining constant until first death First death at 0.64 years One patient censored at 0.10 years 15 patients alive and still under observation right before 0.64 years Calculating the probability of surviving 0.64 years 1 15= 0.933 Survival curve dropping to 0.933 and remaining constant until next death 1 01/21/2021 Lecture 1 15
Kaplan-Meier plot, cont. Next death at 1.81 years One patient censored at 0.97 years 13 patients alive and still under observation right before 1.81 years Calculating the probability of surviving 1.81 years 1 15 1 13 = 0.933 0.923 = 0.862 Survival curve dropping to 0.862 and remaining constant until next death Next death at 2.35 years 12 patients alive and still under observation right before 2.35 years 1 1 01/21/2021 Lecture 1 16
Kaplan-Meier plot, cont. Calculating the probability of surviving 2.35 years 1 15 1 Survival curve dropping to 0.790 and remaining constant until next death Survival curve dropping at each death Remaining constant between two subsequent deaths Censoring only affecting the number alive and still under observation Eventually dropping to 0 if last observation is a death (not a censoring) 1 1 13 1 1 12 = 0.933 0.923 0.917 = 0.790 01/21/2021 Lecture 1 17
Kaplan-Meier plot, cont. 01/21/2021 Lecture 1 18
Kaplan-Meier plot, cont. 01/21/2021 Lecture 1 19
Kaplan-Meier plot, cont. 01/21/2021 Lecture 1 20
Kaplan-Meier plot, cont. Based on some assumptions Independent survival times Starting point and endpoint clearly defined and not changing during the study Life expectancy not changing too much during the study Censoring and endpoint independent of each other Dependent censoring if censoring depends on survival time Illustrated by studying how long you can ride a carousel without throwing up 01/21/2021 Lecture 1 21
Log-rank test Based on the Kaplan-Meier method Used to comparing survival time in two groups Treatment with a drug vs. placebo Tumor thickness in two categories Null hypothesis of no difference in survival between the groups Counting numbers of subjects at each time of death Number still alive and under observation right before: ?1and ?2 Number of deaths : ?1and ?2 01/21/2021 Lecture 1 22
Log-rank test, cont. Calculating total numbers of subjects at each time of death Total number still at risk: ? = ?1+ ?2 Total number of deaths : ? = ?1+ ?2 Calculating expected numbers of deaths at each time of death Under the null hypothesis: ?1= ?1 Finding total observed and expected number of deaths for all times Observed number of deaths: ?1= ?1and ?2= ?2 Expected number of deaths: ?1= ?1and ?2= ?2 ? ? and ?2= ?2 ? ? 01/21/2021 Lecture 1 23
Log-rank test, cont. ?1 ?12 ?1 ?2 ?22 ?2 Calculating test statistic: + Approximately chi-square distributed with 1 degree of freedom 01/21/2021 Lecture 1 24
Example: Primary biliary cirrhosis Considering data from a study on primary biliary cirrhosis 312 patients diagnosed with cirrhosis Referral to Mayo Clinic between January 1974 and May 1984 Patients randomized to one of two groups DPCA (D-penicillamine) Placebo Patients followed until death or censoring End of follow-up in July 1986 01/21/2021 Lecture 1 25
Example: Primary biliary cirrhosis, cont. 125 patients dead by the end of follow-up 65 patients in the DPCA group 60 patients in the placebo group Study described in Chapter 3 of the book by Laake et al. (2007) Data available at https://www.med.uio.no/imb/personer/vit/veierod/boker/epidemiol ogiske-og-kliniske-forskningsmetoder/datafiler/ 01/21/2021 Lecture 1 26
Example: Primary biliary cirrhosis, cont. 01/21/2021 Lecture 1 27
Example: Primary biliary cirrhosis, cont. 01/21/2021 Lecture 1 28
Example: Primary biliary cirrhosis, cont. 01/21/2021 Lecture 1 29
References Aalen OO, Frigessi A, Moger TA, Scheel I, Skovlund E, Veier d MB. Statistiske metoder i medisin og helsefag. Oslo: Gyldendal akademisk; 2006. Laake P, Hjart ker A, Thelle DS, Veier d MB. Epidemiologiske og kliniske forskningsmetoder. Oslo: Gyldendal akademisk; 2007. https://www.med.uio.no/imb/forskning/publikasjoner/boker/2007/e pidemiolgiske-kliniske-forskningsmetoder.html. 01/21/2021 Lecture 1 30