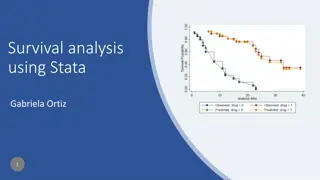
Impact of Cut-Point Selection on IO Survival Estimates

Using KEYNOTE-024 as a case study, this presentation examines the impact of cut-point selection on long-term survival estimates from piecewise modeling in immuno-oncology therapies. It explores the uncertainty in IO survival extrapolations and the use of piecewise survival models as a flexible alternative to standard parametric models for modeling complex hazard profiles.

Download Presentation

Please find below an Image/Link to download the presentation.
The content on the website is provided AS IS for your information and personal use only. It may not be sold, licensed, or shared on other websites without obtaining consent from the author. Download presentation by click this link. If you encounter any issues during the download, it is possible that the publisher has removed the file from their server.
E N D
Presentation Transcript
A Case Study Using KEYNOTE-024 to Examine the Impact of Cut-Point Selection on Long- Term Survival Estimates from Piecewise Modeling 08 May 2023, ISPOR Podium Presentation, P14 Connor Davies and Blake Liu Costello Medical, Boston, MA, USA
Introduction to Immuno-Oncology Therapies Immuno-oncology therapies (IOs) aim to elicit an immune response to destroy malignant cells, whereas conventional anti-cancer therapies act directly on malignant (and healthy) cells Immune checkpoint inhibitors, such as programmed cell death protein 1 (PD-1) blocking monoclonal antibodies, are intended to rescue the antitumor immune response from co-inhibitory signalling that may occur in the tumor microenvironment1 IOs differ from conventional anti-cancer therapies in their mechanism of action and length of action 1. Zhang Y. et al. The history and advances in cancer immunotherapy: understanding the characteristics of tumor-infiltrating immune cells and their therapeutic implications. Cell Mol Immunol. 2020 Aug;17(8):807 821. Abbreviations: IO: immuno-oncology therapy; PD-1: programmed cell death protein 1.
Uncertainty in IO Survival Extrapolations The distinctive mechanism of action for IOs may be associated with long-term survival and/or delayed onset of treatment effects These characteristics of IOs may result in more complex hazard functions compared with conventional anti-cancer therapy that standard parametric functions may not accurately reflect Complex Hazard Function Simple Hazard Functions Complex hazard function Constant hazard function (e.g. exponential distribution) Monotonically increasing hazard function (e.g. Weibull distribution) Hazard function = Event probability at time (t) conditional upon survival until time (t) Abbreviations: IO:immuno-oncology therapy.
Piecewise Survival Models (1/2) Piecewise survival models have been suggested as a flexible alternative to standard parametric models for modeling complex hazard profiles1 One piecewise approach uses the Kaplan Meier (KM) curve for the initial section of the extrapolation, and different survival distributions are then fitted from and adjoined to a pre-determined point on the KM curve2 Survival probability at time (t) = Survival at end of section 1 x Survival at time (t) in section 2 1. Latimer N. NICE DSU Technical Support Document 14: Survival Analysis for Economic Evaluations Alongside Clinical Trials Extrapolation With Patient-Level Data, Version 2: National Institute for Health and Care Excellence, Decision Support Unit, 2013; 2. Rutherford MJ. et al. NICE DSU Technical Support Document 21. Flexible Methods for Survival Analysis. 2020. Abbreviations: KM: Kaplan Meier.
Piecewise Survival Models (2/2) Strengths Limitations Piecewise models are more flexible than standard parametric models There are no definitive rules for the selection of the best cut-point as found in a review of survival extrapolation methods in the 20 most recent oncology submissions to the National Institute for Health and Care Excellence (NICE), as of 10 December, 20211 They may be more biologically plausible for IOs with distinct mechanisms of action Other flexible models can also be implemented in a piecewise approach Numbers at risk on which to fit parametric models are reduced in later segments of the KM curve If the cut-point or models used for each section are not appropriate, results will not be reliable The selection of cut-points is often a point of contention when using piecewise models 1. Liu, B. L., and Matthew Griffiths. "EE111 Adoption of Piecewise Modelling: A Review of Nice Health Technology Appraisals in Oncology." Value in Health 25.7 (2022): S356. Abbreviations: IO:immuno-oncology therapy; KM: Kaplan Meier; NICE: National Institute for Health and Care Excellence.
Objective The objective of this study was to answer the following questions: 1. How accurate are piecewise model long-term survival estimates compared with standard parametric model estimates for an IO 2. How influential is the selection of cut-point on long-term survival estimates and accuracy Abbreviations: IO:immuno-oncology therapy.
KEYNOTE-024 KEYNOTE-024 investigated pembrolizumab, a PD-1 monoclonal antibody for the treatment of patients with previously untreated advanced non-small cell lung cancer, and was selected as a case study given multiple data-cuts were available1,2 Published overall survival (OS) data are available from two data-cuts 1st data-cut: median follow-up 25.2 months (longest duration of published OS data was 33.0 months) 2nd data-cut: median follow-up 59.9 months (longest duration of published OS data was 65.8 months) 1. Reck M. et al. Updated Analysis of KEYNOTE-024: Pembrolizumab Versus Platinum-Based Chemotherapy for Advanced Non-Small-Cell Lung Cancer With PD-L1 Tumor Proportion Score of 50% or Greater. J Clin Oncol. 2019 Mar 1;37(7):537 546; 2. Reck M. et al. Five-Year Outcomes With Pembrolizumab Versus Chemotherapy for Metastatic Non-Small-Cell Lung Cancer With PD-L1 Tumor Proportion Score 50. J Clin Oncol. 2021 Jul 20;39(21):2339 2349. Abbreviations: IO: immuno-oncology therapy; OS: overall survival; PD-1: programmed cell death protein 1.
Methodology Standard Parametric Models Published overall survival (OS) KM curves of pembrolizumab for each KEYNOTE-24 data-cut were digitized1,2 Pseudo individual patient data (IPD) were generated using the algorithm described by Guyot et al. (2012)3 The six standard parametric models were fitted to the pseudo IPD derived from the 25.2-month data-cut Statistical fit was assessed for every curve for each data-cut using the Akaike information criterion (AIC) and the Bayesian information criterion (BIC) StandardParametric Models Exponential Weibull LogNormal LogLogistic Gompertz GenGamma 1. Reck M. et al. Updated Analysis of KEYNOTE-024: Pembrolizumab Versus Platinum-Based Chemotherapy for Advanced Non-Small-Cell Lung Cancer With PD-L1 Tumor Proportion Score of 50% or Greater. J Clin Oncol. 2019 Mar 1;37(7):537 546; 2. Reck M. et al. Five-Year Outcomes With Pembrolizumab Versus Chemotherapy for Metastatic Non-Small-Cell Lung Cancer With PD-L1 Tumor Proportion Score 50. J Clin Oncol. 2021 Jul 20;39(21):2339 2349; 3. Guyot P. et al. Enhanced Secondary Analysis of Survival Data: Reconstructing the Data from Published Kaplan Meier Survival Curves. BMC medical research methodology 2012;12:1 13. Abbreviations: AIC: Akaike information criterion; BIC: Bayesian information criterion; IPD: individual patient data; KM: Kaplan Meier; OS: overall survival.
Methodology Piecewise Models For the piecewise models, 3-, 8- and 14-months were chosen as cut-points by visually inspecting where distinct changes in the hazard profile occurred on smoothed, cumulative, and log cumulative hazard plots of the pseudo IPD from the 25.2-month data-cut From the cut-points onwards, the six standard parametric tails were fitted to the remaining KM data and adjoined to the KM curves at the respective cut-point Piecewise Models ParametricTails Exponential Weibull LogNormal LogLogistic Gompertz GenGamma KM Curves 3-month cut-point 8-month cut-point 14-month cut-point + Abbreviations: IPD: individual patient data; KM: Kaplan Meier.
Methodology Life Year Calculations 1. The predicted cumulative life years (LYs) were calculated for each model over a 65.8-month time horizon (longest duration of published OS from the 59.9-month data-cut)1 2. Predicted LYs were then compared to realized cumulative LYs over this period (calculated as an absolute percentage difference) to determine long-term survival estimate accuracy KM Data Extrapolation KM Data KEYNOTE-024 1st data-cut (25.2 months) KEYNOTE-024 2nd data-cut (59.9 months) Predicted cumulative life years Realized cumulative life years 1. Reck M. et al. Five-Year Outcomes With Pembrolizumab Versus Chemotherapy for Metastatic Non-Small-Cell Lung Cancer With PD-L1 Tumor Proportion Score 50. J Clin Oncol. 2021 Jul 20;39(21):2339 2349. Abbreviations: KM: Kaplan Meier; LY: life year; OS: overall survival.
Results Survival Extrapolations (Visual Fit) KM data from 25.2 month data-cut Extrapolations derived from 25.2 month data-cut Abbreviations: KM: Kaplan Meier.
Results Survival Extrapolations (Statistical Fit, 1/2) Goodness-of-Fit Statistics (1/2) Type of model Parametric model AIC BIC AIC rank BIC rank Lower AIC/BIC indicate better fit. However standard models and models with different cut-points cannot be directly compared due to differing numbers at risk on which the models were fit Exponential 681.55 684.59 6 1 Weibull 680.11 686.18 4 5 LogNormal 679.97 686.04 3 4 Standard parametric LogLogistic 678.80 684.88 2 3 Gompertz 678.58 684.65 1 2 GenGamma 680.92 690.04 5 6 Piecewise Exponential 542.41 545.45 5 1 Piecewise Weibull 541.87 547.95 4 5 Piecewise LogNormal 541.61 547.68 3 4 Piecewise model with 3-month cut-point Piecewise LogLogisitic 541.05 547.12 2 3 Piecewise Gompertz 540.91 546.98 1 2 Piecewise GenGamma 542.95 552.06 6 6 Abbreviations: AIC: Akaike information criterion; BIC: Bayesian information criterion.
Results Survival Extrapolations (Statistical Fit, 2/2) Goodness-of-Fit Statistics (2/2) Type of model Parametric model AIC BIC AIC rank BIC rank Piecewise Exponential 340.90 343.94 3 1 Piecewise Weibull 342.75 348.83 6 5 Piecewise LogNormal 339.59 345.67 1 2 Piecewise model with 8- month cut-point Piecewise LogLogisitic 341.58 347.66 4 3 Piecewise Gompertz 342.59 348.66 5 4 Piecewise GenGamma 340.53 349.64 2 6 Piecewise Exponential 1019.87 1022.90 6 6 Piecewise Weibull 1010.66 1016.73 2 2 Piecewise LogNormal 1012.06 1018.13 5 4 Piecewise model with 14-month cut-point Piecewise LogLogisitic 1009.58 1015.65 1 1 Piecewise Gompertz 1011.17 1017.25 3 3 Piecewise GenGamma 1011.19 1020.30 4 5 Abbreviations: AIC: Akaike information criterion; BIC: Bayesian information criterion.
Results Survival Extrapolations (Prediction Accuracy) KM data from 59.9 month data-cut Extrapolations derived from 25.2 month data-cut Abbreviations: KM: Kaplan Meier.
Results Life Year Comparisons The realized LYs from the KEYNOTE-024 59.9-month data-cut were 2.71 12.0 Mean=3.50% Mean=3.53% Mean=3.06% Mean=5.39% Average predicted LYs across the standard parametric models were 2.70. Average mean LYs varied across piecewise models with different cut-points: 10.0 .0 .0 3-month: 2.72 .0 8-month: 2.68 14-month: 2.82 2.0 The most accurate model was the 8- month piecewise model with a LogNormal tail (absolute % LY difference=0.24%) 0.0 o or l o or l o or l o or l en en en en o o istic o o istic o o istic o o istic o pert o pert o pert o pert eibull eibull eibull eibull ponenti l ponenti l ponenti l ponenti l St n r p r etric Piece ise o el ith 3 onth cut point Piece ise o el ith onth cut point Piece ise o el ith 1 onth cut point On average, models based on the 14-month cut-point performed the worst Over-prediction Mean absolute % LY difference between predicted and realized LYs Under-prediction Abbreviations: LY: life year.
Conclusions Despite being more flexible, the piecewise models in this case study did not perform better than standard parametric models in estimating long-term survival based on average predicted LYs, although the 3- and 8-month cut-point models performed similarly to standard parametric models In terms of mean absolute % LY difference between predicted and realized LYs, the 3-month cut-point models performed similarly to the standard parametric models, and the 8-month cut-point models performed better. The spread in under/over prediction also appeared to decrease with the 3- and 8-month cut-point models The piecewise model with 8-month cut-point and LogNormal tail performed the best, followed by standard Generalized Gamma and LogLogistic parametric models, but the differences among them were marginal (0.24% vs 0.26% vs 0.80%) The 14-month cut-point models on average performed the worst. The reduced accuracy at later timepoints likely reflected the reduced number at risk on which to fit the parametric tails Abbreviations: LY: life year.
Acknowledgements Matt Griffiths Alex Porteous Hannah Harrington Joanna Honc Contact details: connor.davies@costellomedical.com


")
")


")
")
")
")