Understanding Pictograms: Interpreting Data with Different Scales
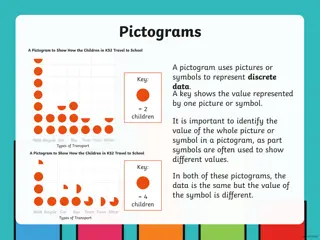
Learn how to interpret pictograms with varying scales by solving problems related to hair colors, animals, fruits, ice cream flavors, lollipops, and trees. Practice counting in 2s, 5s, and 10s to determine totals, differences, and combined amounts of different items represented in pictorial form.

Download Presentation

Please find below an Image/Link to download the presentation.
The content on the website is provided AS IS for your information and personal use only. It may not be sold, licensed, or shared on other websites without obtaining consent from the author. Download presentation by click this link. If you encounter any issues during the download, it is possible that the publisher has removed the file from their server.
E N D
Presentation Transcript
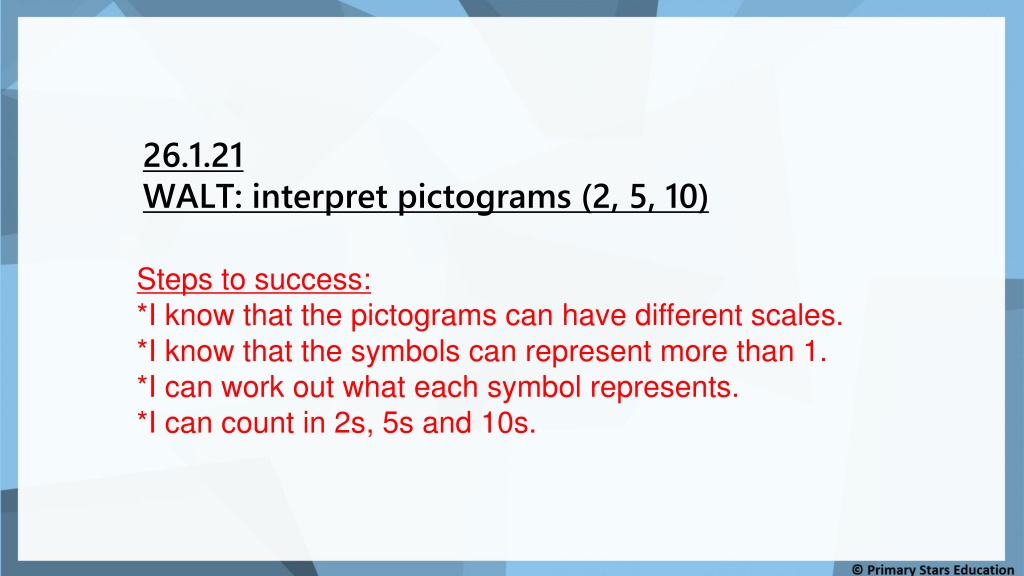
26.1.21 WALT: interpret pictograms (2, 5, 10) Steps to success: *I know that the pictograms can have different scales. *I know that the symbols can represent more than 1. *I can work out what each symbol represents. *I can count in 2s, 5s and 10s.
Fluency Hair colour Black Brown Blonde Ginger KEY: = 2 15 a) How many people have blonde hair? _________ b) Find the difference between people with ginger hair and black. _________ c) How many more people with brown hair than black? _________ 11 5
Fluency Animals Lion Elephant Giraffe Rhino KEY: = 2 14 a) What is the total number of lions? _________ b) Find the difference between the giraffes and elephants. _________ c) How many fewer rhinos than lions? _________ 13 3
Fluency Fruit Apple Banana Orange Grapes KEY: = 5 40 a) What is the total number of grapes? _________ b) Find the difference between the bananas and apples. _________ c) How many more grapes than oranges? _________ 25 15
Fluency Animal Cow Pig Horse Chicken KEY: = 5 45 a) What is the total number of horses? _________ b) Find the difference between the pigs and chickens. _________ c) What is the combined total of cows and chickens? 20 _________ 40
Fluency Ice cream Vanilla Chocolate Strawberry Mint KEY: = 10 95 a) What is the total number of people who like strawberry? _________ b) Find the difference between chocolate and mint. _________ c) How many more like strawberry than vanilla? _________ 75 5
Fluency Lollies Blackcurrant Orange Strawberry Lemon KEY: = 10 35 a) What is the total number of people who like lemon? _________ b) Find the difference between orange and blackcurrant. _________ c) What is the combined total of strawberries and lemons? 35 _________ 85
Problem solving Complete the pictogram using the clues. Tree Ash KEY: = 5 Birch Elm Oak 1. There are 50 ash. 2. There are 5 more birch than ash. 3. There are 20 fewer elm than birch. 4. There are 15 less oak than elm.