Understanding Synoptic Meteorology: A Comprehensive Overview
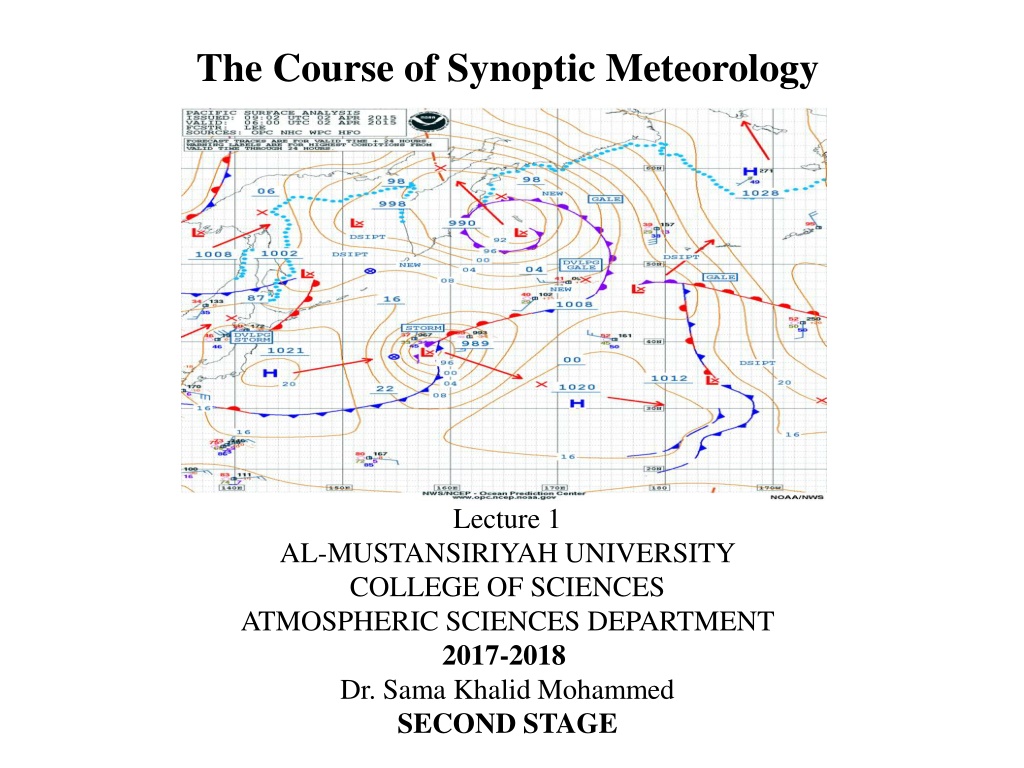

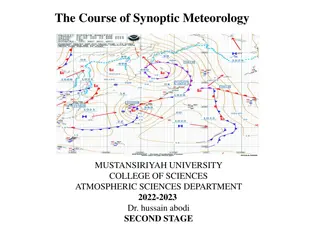
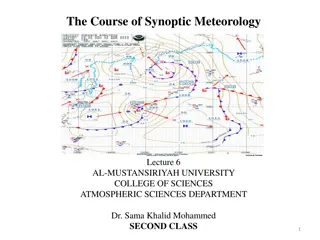
The Course of Synoptic Meteorology
Lecture 1
AL-MUSTANSIRIYAH UNIVERSITY
COLLEGE OF SCIENCES
ATMOSPHERIC SCIENCES DEPARTMENT
2017-2018
Dr. Sama Khalid Mohammed
SECOND STAGE


Welcome Students In The New Course
and In The First Lecture
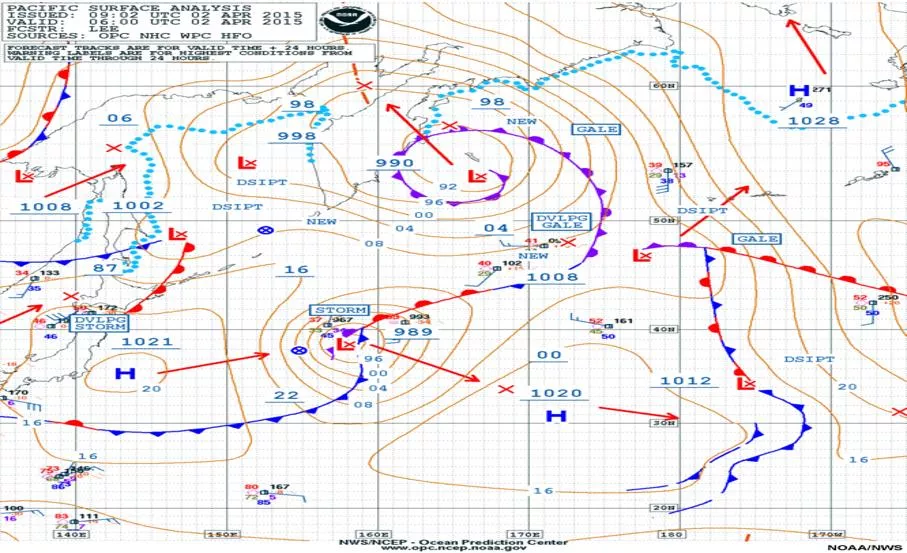
Weather Maps
Surface maps and upper air maps.
Contouring Weather Maps
Contour lines and types, pressure analysis, Low and high pressure systems and
their extensions, discontinuity, waves.
Air Masses
Types of air masses, formation methods of air masses, prevailing air masses,
thermal inversions.
What are covered in this course?
Life Time of Frontal Low
Classical model, Structure of open wave, subtropical and polar jet streams.
Fronts
Introduction, warm front, warm front circulation, cold front, cold front
circulation, horizontal and vertical structure of cold front, frontal theory, rule of
locating fronts on weather maps.
Jet Stream
Definision, its types (subtropical and polar jet streams).
Introduction
Scales of Atmospheric Motion,
Synoptic Meteorology, Analysis and interpretation.
References
1.
G., Lackmann,2011:MidlatitudeSynopticMeteorologyDynamics,
Analysis & Forecasting, American Meteorological Society, 345 p.
2.
C.D.,
Ahrens, 2008:Essentials of Meteorology. Thomson
Brooks/Cole, 504 p.
3.
A., Lehkonen, 2013: Synoptic Meteorology, Eumetrain, 190 p.
4.
https://www.meted.ucar.edu/index.php
5.
م
ن
ع
م
ا
ل
ج
ب
و
ر
ي
و
س
ن
ا
ء
ع
ب
د
ا
ل
ج
ب
ا
ر
،
2
0
1
0
:
ت
ج
ا
ر
ب
ع
م
ل
ی
ة
ف
ي
ا
ل
ر
ص
د
و
ا
ل
ت
ح
ل
ی
ل
و
ا
ل
ت
ن
ب
ؤ
.
م
ؤ
س
س
ة
م
ص
ر
–
م
ر
ت
ض
ى
،
ب
غ
د
ا
د
.
2
8
4
ص
.
Introduction
Synopsis
: forming a broad but robust picture of the general state of the
atmosphere.
in
Synoptic
, all information concerning the state of the troposphere is
taken into account: observations and the parameters produced by
numerical models.
Synoptic
: from “Synoptikos”, a Greek word, means “presenting a
summary of the principal parts or a general view of the whole”
or “view
together
”.
For us, it means that you take everything you learned from physical
meteorology, dynamic meteorology, remote sensing, and put them
together.
Synoptic will help a meteorologist to understand the state of the
troposphere; what is happening and why, and what might be taking place
in the near future.
The atmosphere is the mass of air surrounding the earth and bound to it
more or less permanently by the earth's gravitational attraction, and is the
most unstable
part of the climate system, and its processes contribute to the variability
of the climate system on a wide range of spatial and temporal scales.
Meteorologists arrange circulations according to their size, start from
tiny gusts to giant storms which is called the
scales of motion
.
Scales of Atmospheric Motion
Synoptic meteorology traditionally involves the study of weather
systems, such as extra-tropical high and low pressure systems, jet
streams and associated waves, and fronts.
Consider smoke rising into the otherwise clean
air from a chimney in the industrial section of a
large city. Within the smoke, small chaotic
motion (tiny eddies) cause it to tumble and turn.
These eddies constitute the smallest scale of
motion ”
The Microscale
”, in which eddies
have diameters of a few meters or less and they
form by convection or by the wind blowing past
obstructions and are usually short-lived, lasting
only a few minutes at best.
As the smoke rises, it drifts toward the center of
town. Here the smoke rises even higher and is
carried back toward the industrial section. This
circulation of city air constitutes the next larger
scale “
The mesoscale
” (meaning middle scale).
Typical mesoscale winds range from a few
kilometers to about a hundred kilometers in
diameter. Generally, they last longer than
microscale motions, often many minutes, hours,
or in some cases as long as a day. Mesoscale
circulations include local winds (which form
along shorelines and mountains), as well as
thunderstorms, tornadoes, and small tropical
storms.
When we look for the smokestack on a surface
weather map, neither the smokestack nor the
circulation of city air shows up. All that we see are
the circulations around high and low pressure areas.
We are now looking at the
synoptic scale,
or
weather map scale
or
cyclonic scale
(a scale at
which atmospheric phenomena at horizontal
dimensions that are much larger than their vertical
dimensions. It is the typical weather map scale that
shows features such as high- and low pressure areas
and fronts over a distance spanning a continent).
Circulations of this magnitude dominate regions of
hundreds to even thousands of square kilometres
and, although the life spans of these features vary,
they typically last for days and sometimes weeks.
The largest wind patterns are seen at the
planetary
(global)
scale
.
Here, we have wind patterns ranging over the entire earth.
Scales of Atmospheric Motion
(Table 1.1 summarizes the various scales of motion and their average life span.)
The tasks of a synoptic meteorologist:
Analysis and interpretation
Synoptic interpretation of the state of the troposphere, a four-
dimensional concept of the state of the weather:
simultaneous consideration of observations and numerical
prediction fields
Observations includes:
•
Synop observations
•
other observations: automatic, flight and road weather observations
soundings
•
satellite images
•
radar images
•
observations from airplanes
A lot of observational data goes straight into the initial conditions of
models. In particular, information from satellites is used to patch up the
sparse network of oceanic observations.
Synop observations are analyzed. Analysis means:
• visualizing the isolines of parameters
• defining the areas where a given phenomenon may occur
• identifying observational errors
• achieving an unambiguous interpretation of the data
An analysis will also suggest which numerical parameters are to be paid
attention to!
Example: analyzing surface SYNOP observations
Isolines of isobars
Surface pressure tendency isolines or isallobars
Local weather (areas with precipitation, fog/mist, thunder,
showers, etc.)
Wind convergence zones
Isotherms
Other things (as required); wildfires, sizable dust clouds, etc.
1.
Low pressure center
2.
Secondary low center
3.
Low pressure trough
4.
High pressure center
5.
Secondary high center
6.
High pressure ridge
7.
Saddle point
Conceptual models:
simplified representations of the
properties of weather systems
are not necessarily unequivocal;
weather systems are formed, die out,
undergo change and are not always
clear with regard to every parameter
vary according to surface, season
and time of day
contain information about a system's
development over time
There are manuals of conceptual
models (SatManu, Lehkonen:
käsitemallit), but interpreting the
weather is subjective.
Why do we need manual analysis and interpretation?
Conceptual models cannot be identified automatically with existing
equipment
One can spot errors in the model and anticipate developments that
differ from the model’s predictions
Local conditions and factors relevant on the mesoscale can be taken
into account (surface, season, history, etc.)
Humans can infer observational errors and the effects of sub-synoptic
scale weather and environmental phenomena better than programs.
Drawing lines and conceptual models on a map improves one’s
understanding of the issue at hand more than simply looking at
finished products.
An analyzed chart can be:
o
Working chart for oneself and colleagues such as Surface charts
o
Product for a customer such as
– Weather charts for magazines
– Briefing charts for aviation
– Ice and wind charts for shipping
Synoptic meteorology delves into various aspects of atmospheric sciences, encompassing scales of atmospheric motion, weather maps, air masses, fronts, jet streams, and more. Through the study of synoptic meteorology, meteorologists gain insights into interpreting the state of the troposphere and forecasting future atmospheric conditions. References to key textbooks and resources in the field are provided, aiding in a deeper understanding of the subject.

Download Presentation

Please find below an Image/Link to download the presentation.
The content on the website is provided AS IS for your information and personal use only. It may not be sold, licensed, or shared on other websites without obtaining consent from the author. Download presentation by click this link. If you encounter any issues during the download, it is possible that the publisher has removed the file from their server.
E N D
Presentation Transcript
The Course of Synoptic Meteorology Lecture 1 AL-MUSTANSIRIYAH UNIVERSITY COLLEGE OF SCIENCES ATMOSPHERIC SCIENCES DEPARTMENT 2017-2018 Dr. Sama Khalid Mohammed SECOND STAGE
Welcome Students In The New Course and In The First Lecture Welcome Students In The New Course and In The First Lecture
What are covered in this course? Introduction Scales of Atmospheric Motion, Synoptic Meteorology, Analysis and interpretation. Weather Maps Surface maps and upper air maps. Contouring Weather Maps Contour lines and types, pressure analysis, Low and high pressure systems and their extensions, discontinuity, waves. Air Masses Types of air masses, formation methods of air masses, prevailing air masses, thermal inversions. Fronts Introduction, warm front, warm front circulation, cold front, cold front circulation, horizontal and vertical structure of cold front, frontal theory, rule of locating fronts on weather maps. Life Time of Frontal Low Classical model, Structure of open wave, subtropical and polar jet streams. Jet Stream Definision, its types (subtropical and polar jet streams).
References 1. G., Lackmann,2011:MidlatitudeSynopticMeteorologyDynamics, Analysis & Forecasting, American Meteorological Society, 345 p. 2. C.D., Ahrens, 2008:Essentials of Meteorology. Thomson Brooks/Cole, 504 p. 3. A., Lehkonen, 2013: Synoptic Meteorology, Eumetrain, 190 p. 4. https://www.meted.ucar.edu/index.php . 2010 . 284 . : .5
Introduction Synopsis: forming a broad but robust picture of the general state of the atmosphere. in Synoptic, all information concerning the state of the troposphere is taken into account: observations and the parameters produced by numerical models. Synoptic: from Synoptikos , a Greek word, means presenting a summary of the principal parts or a general view of the whole or view together . For us, it means that you take everything you learned from physical meteorology, dynamic meteorology, remote sensing, and put them together. Synoptic will help a meteorologist to understand the state of the troposphere; what is happening and why, and what might be taking place in the near future.
Synoptic meteorology traditionally involves the study of weather systems, such as extra-tropical high and low pressure systems, jet streams and associated waves, and fronts. Scales of Atmospheric Motion The atmosphere is the mass of air surrounding the earth and bound to it more or less permanently by the earth's gravitational attraction, and is the most unstable part of the climate system, and its processes contribute to the variability of the climate system on a wide range of spatial and temporal scales. Meteorologists arrange circulations according to their size, start from tiny gusts to giant storms which is called the scales of motion.
Consider smoke rising into the otherwise clean air from a chimney in the industrial section of a large city. Within the smoke, small chaotic motion (tiny eddies) cause it to tumble and turn. These eddies constitute the smallest scale of motion The Microscale , in which eddies have diameters of a few meters or less and they form by convection or by the wind blowing past obstructions and are usually short-lived, lasting only a few minutes at best.
As the smoke rises, it drifts toward the center of town. Here the smoke rises even higher and is carried back toward the industrial section. This circulation of city air constitutes the next larger scale The mesoscale (meaning middle scale). Typical mesoscale winds range from a few kilometers to about a hundred kilometers in diameter. Generally, they last longer than microscale motions, often many minutes, hours, or in some cases as long as a day. Mesoscale circulations include local winds (which form along shorelines and mountains), as well as thunderstorms, tornadoes, and small tropical storms.
When we look for the smokestack on a surface weather map, neither the smokestack nor the circulation of city air shows up. All that we see are the circulations around high and low pressure areas. We are now looking at the synoptic scale, or weather map scale or cyclonic scale (a scale at which atmospheric phenomena at horizontal dimensions that are much larger than their vertical dimensions. It is the typical weather map scale that shows features such as high- and low pressure areas and fronts over a distance spanning a continent). Circulations of this magnitude dominate regions of hundreds to even thousands of square kilometres and, although the life spans of these features vary, they typically last for days and sometimes weeks. The largest wind patterns are seen at the planetary (global) scale. Here, we have wind patterns ranging over the entire earth.
Scales of Atmospheric Motion (Table 1.1 summarizes the various scales of motion and their average life span.)
Analysis and interpretation The tasks of a synoptic meteorologist: Combining the analyzed observations and numerical parameters with conceptual models Analysis of weather observations Interpretation of numerical fields
Synoptic interpretation of the state of the troposphere, a four- dimensional concept of the state of the weather: simultaneous consideration of observations and numerical prediction fields analysis the current state of the troposphere diagnostic laws of physics understanding the state of the troposphere prognostic laws of physics the future state of the troposphere
Observations includes: Synop observations other observations: automatic, flight and road weather observations soundings satellite images radar images observations from airplanes A lot of observational data goes straight into the initial conditions of models. In particular, information from satellites is used to patch up the sparse network of oceanic observations. Synop observations are analyzed. Analysis means: visualizing the isolines of parameters defining the areas where a given phenomenon may occur identifying observational errors achieving an unambiguous interpretation of the data An analysis will also suggest which numerical parameters are to be paid attention to!
Example: analyzing surface SYNOP observations Isolines of isobars Surface pressure tendency isolines or isallobars Local weather (areas with precipitation, fog/mist, thunder, showers, etc.) Wind convergence zones Isotherms Other things (as required); wildfires, sizable dust clouds, etc. 1. Low pressure center 2. Secondary low center 3. Low pressure trough 4. High pressure center 5. Secondary high center 6. High pressure ridge 7. Saddle point
Conceptual models: simplified representations of the properties of weather systems are not necessarily unequivocal; weather systems are formed, die out, undergo change and are not always clear with regard to every parameter vary according to surface, season and time of day contain information about a system's development over time There are manuals of conceptual models (SatManu, k sitemallit), but interpreting the weather is subjective. Lehkonen:
Why do we need manual analysis and interpretation? Conceptual models cannot be identified automatically with existing equipment One can spot errors in the model and anticipate developments that differ from the model s predictions Local conditions and factors relevant on the mesoscale can be taken into account (surface, season, history, etc.) Humans can infer observational errors and the effects of sub-synoptic scale weather and environmental phenomena better than programs. Drawing lines and conceptual models on a map improves one s understanding of the issue at hand more than simply looking at finished products.
An analyzed chart can be: o Working chart for oneself and colleagues such as Surface charts o Product for a customer such as Weather charts for magazines Briefing charts for aviation Ice and wind charts for shipping