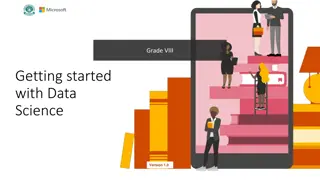
Exploring Data Science: Grade IX Version 1.0

Delve into the world of data science with Grade IX Version 1.0! This educational material covers essential topics such as the definition of data, distinguishing data from information, the DIKW model, and how data influences various aspects of our lives. Discover the concept of data footprints, data loss, and recovery, and understand the significance of studying data for decision-making and knowledge acquisition. Unravel the impact of data on healthcare, online shopping, education, travel, and entertainment. Dive deep into the realm of data with this comprehensive guide.

Download Presentation

Please find below an Image/Link to download the presentation.
The content on the website is provided AS IS for your information and personal use only. It may not be sold, licensed, or shared on other websites without obtaining consent from the author. Download presentation by click this link. If you encounter any issues during the download, it is possible that the publisher has removed the file from their server.
E N D
Presentation Transcript
Grade IX Data Science Version 1.0
Chapter 1: Introduction to data At the end of this chapter, students will understand the usefulness of studying data. They will know: What is data and information? What is DIKW Model? How data influences our lives? What are data footprints? Data loss and recovery
What is Data? Whatever we can read, write, speak, and observe is data. Every day we share so much data when we read, write, speak, and watch. It can be numbers, alphabets, symbols, or a combination of all of these. Data can be defined as facts or information which when stored, can be used as a basis for decision making, calculation, or discussion.
Data vs. Information Data can be a number, symbol, or text, which may not mean anything to individuals on its own. However, when data is processed and put in context, they bear a meaning. This means data can be used for decision-making, calculations, or discussions. The data then becomes information.
DIKW Model Data after transformation to information can also be converted to knowledge and wisdom. This is called the DIKW model, which explains how we move from Data to Information to Knowledge to Wisdom.
How data influences our lives? Data heavily influence our daily lives, Starting from online shopping to watching our favorite shows on television to ordering food from the best restaurants. Data and data analysis have a significant impact on our lives. Few aspects of our lives that are impacted by data are: Healthcare Online shopping Education Travel Online shows
What are data footprints? In our daily life, the internet has become an essential part. With all the activities we do on the internet, we create trails of data. These trails of data are called data footprints. We create digital footprints that can be used to identify us as individuals. This image shows how we connect to the rest of the world and the people around us.
Data loss and recovery Data can be lost, corrupted, damaged, or deleted due to multiple reasons like transaction failure, system crash, or disk failure. The process of restoring inaccessible, lost, corrupted, damaged, or deleted data is called data recovery. To prevent data loss, we should frequently back up our data. Large enterprise systems generally use backup data storage from where they recover the data in case of any loss.
Chapter 2: Arranging and Collecting data At the end of this chapter, Students will understand how to arrange and collect data. They will know: What is data collection? What are variables? What are data sources? What is big data? Asking questions on data Univariate vs. Multivariate data
What is data collection? The method of gathering data for calculating and analyzing reliable insights is known as data collection, which is done using standard validated techniques. A researcher or scientist works based on the collected data. Data collection is a primary and essential step in most cases.
What are variables? A variable is an attribute of an object of study that may vary for different cases. Thus, a variable varies for different case studies in research. Now variables can be of two types. Numerical variable They represent values that have numbers. For Example, age, weight, height. Categorical variable These variables represent values that have words, for example, name, nationality, sport, etc.
Types of data Data can be divided into two categories, quantitative and qualitative.
Types of data sources Data sources can be classified into primary and secondary sources.
What is big data? When the data volumes exceed the processing capacities of traditional databases, they are called Big Data. Millions of users are using the social media platforms and creating an enormous amount of content every minute. Systems, which can extract statistical insights from a huge amount of data, are called Big Data systems.
Questioning your data Data is typically stored as numbers (numeric) or labels (categories). Based on the type of data, we need to ask five simple questions from the data. These are the 5 types of algorithms we will learn in this section
Univariate vs Multivariate data Univariate data is a type of data that has only one variable or which does not involve multiple parameters or relationships. For Example, the height of students is univariate data. Multivariate data is a type of data which involves a relationship between multiple variables For Example, sales of umbrellas increase during the rainy season. We see umbrella sales are dependent on rainfall. So, there are two variables "rainfall" and "sales." These types of data are more complex than univariate as they involve comparisons and relations with multiple parameters.
Chapter 3: Data Visualizations At the end of this chapter, students will understand how to visualize data and make it more comprehendible. They will know: The importance of visualization Plotting data Histograms Use of shapes Use of single and multivariable plots
Importance of data visualization With so much information around us, it is challenging to view the data and derive insights from it. Representing data through visualizations like graphs, charts, maps, etc., gives us a visual context of the data. It also makes complex data simple and enables the human mind to understand its significance.
Plotting data There are different ways to visualize data depending on the data being modeled and its purpose. Different kinds of graphs and tables can be used to visualize the data. Students will learn about the following in this section: Dot plots Bar graphs Maximum and Minimum Frequency
Dot Plot A dot plot is a graphical display of data using dots. Dots are used in dot plots to illustrate the quantitative values associated with the categorical values. For Example, Minutes to reach school. This data shows how long does it take five people to reach the school. Minutes: 6, 2, 4, 8, 5 Person: A, B, C, D, E
Bar Graphs A bar graph is a graphical display of data using bars of different heights. It is possible to plots the bars vertically or horizontally. In a bar graph, the bars are presented to show elements so that they do not touch each other.
Column Chart A bar graph is called a column chart or graph.
Maximum and Minimum The minimum of the data is less than or equal to any other values in our data set. If we had to order all our data in ascending order, so the first number in our list would be the minimum. The maximum of the data is greater than or equal to all other values. If we had to order all our data in ascending order, so the last number listed would be the maximum.
Frequency The frequency of a data value is the number of times the data value occurs/repeats. For Example, if five students have a score of 85 in English, the score of 85 is said to have a frequency of 5. The frequency of a data value is often represented by f.
Histograms and Use of shapes A histogram is a graphical display of data using bars of different heights. It is used to summarize discrete or continuous data. In other words, a histogram displays the number of data points that fall within a given set of values (called 'bins') to provide a visual representation of numeric data. Unlike a vertical bar graph, a histogram shows no gaps between the bars.
Example of a multi variable plot Use of single and multivariable plots 50 45 40 35 Finally, the students will learn about the use of single and multivariable plots. They will also learn to visualize relationships between more than one variable 30 25 20 15 10 5 0 Jan Feb Mar Apr May Jun Jul Aug Sep Oct Nov Dec Company A Company B Company C
Chapter 4: Ethics in data science At the end of this chapter, students will understand the following: Ethical guidelines around data analysis Need for ethical guidelines in data analysis Goals of ethical guidelines in data analysis Data governance framework Why do we need to govern data? Goals of data governance
Why do we need ethical guidelines There are many reasons why adhering to ethical guidelines in data analysis is essential. Guidelines encourage facts, knowledge, and error avoidance. For Example, prohibitions against falsifying, fabricating, or misrepresenting data promote the truth and minimize error. Ethical guidelines in data analysis also help to build public support for the analysis. People are more likely to confide in the analysis if they can trust data quality and integrity. Before conducting any new analysis, we ask ourselves whether it will benefit the people. If it doesn't, we will not do it. Minimizing data usage, we should use the least amount of data necessary to meet the desired objective, understanding that reducing data usage encourages more sustainable and less risky analysis
To Improve data quality through efforts to identify and fix errors in data sets. To increase analytics accuracy and give decision-makers reliable information. To ensure compliance with data privacy laws and other regulations Why do we need to govern data? To implement and enforce policies that help prevent data errors and misuse To avoid inconsistent data in different departments and business units To come to an agreement on standard data definitions for a shared understanding of data
Final Project Finally, we expect the students to finish two final projects with the teachers' help to understand the concepts learned in the previous chapters.