Understanding Pictograms in Statistics: Interpreting Symbolic Representations

Explore the concept of pictograms where symbols represent 5 or 10 items. Learn how to interpret pictograms using keys and symbols, making data visualization easier and quicker. Enhance your understanding through examples and key vocabulary, helping you decode information efficiently.

Download Presentation

Please find below an Image/Link to download the presentation.
The content on the website is provided AS IS for your information and personal use only. It may not be sold, licensed, or shared on other websites without obtaining consent from the author. Download presentation by click this link. If you encounter any issues during the download, it is possible that the publisher has removed the file from their server.
E N D
Presentation Transcript
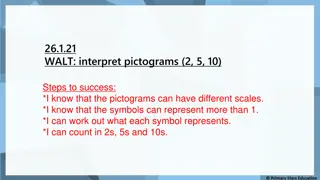
Year 2 Statistics Lesson 7 - Interpret a pictogram where the symbol represents 5 or 10 items
Unit: Statistics Number Fact check
What do we already know? A table can be used to display pieces of data about different things. The fifth tally mark is always drawn across the other four like this llll. A pictogram uses pictures to represent data. The key tells us how many items each symbol represents. a symbol represents of the amount. The key tells us how many items each symbol represents.
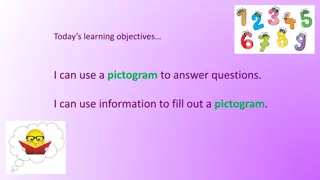
We are learning to: Interpret a pictogram where the symbol represents 5 or 10 items. How many?
Hook BBC Bitesize: Understanding pictograms https://www.bbc.co.uk/bitesize/clips/zg4d2hv
Key Vocabulary: Teach it data table headings What is a pictogram? column most least tally chart pictogram symbol represents We know that a pictogram is a chart that uses pictures or symbols to show information. It is quicker and easier to interpret results in a pictogram than a tally chart. In this pictogram each symbol (ice-cream) represents 1 child. Stem Sentence: The key tells us how many items each symbol represents.
Key Vocabulary: Teach it data table headings We need to look at the key to see how many items each symbol represents. column most least tally chart pictogram symbol represents In this pictogram each symbol (smiley face) represents 5 children. Stem Sentence: The key tells us how many items each symbol represents.
Key Vocabulary: Teach it data table headings We need to look at the key to see how many items each symbol represents. column most least tally chart pictogram symbol represents In this pictogram each symbol (green triangle) represents 10 children. Stem Sentence: The key tells us how many items each symbol represents.
Teach it We can use our knowledge of the 5 times table to count symbols. Key = 5 cats. = How many cats are there? There are 25 cats. Stem Sentence: The key tells us how many items each symbol represents.
Teach it Lets check! = = = = = There are 25 cats. Stem Sentence: The key tells us how many items each symbol represents.
Teach it We can use our knowledge of the 10 times table to count symbols. Key = 10 trees. = How many trees are there? There are 40 trees. Stem Sentence: The key tells us how many items each symbol represents.
Teach it Lets check! = = = = There are 40 trees. Stem Sentence: The key tells us how many items each symbol represents.
Key Vocabulary: Teach it data table headings We know that in this pictogram each symbol represents 10 children. column most least tally chart pictogram symbol represents There is a square. of 10 is 5. This symbol represents 5 children. Look carefully! What do you notice? Stem Sentence: The key tells us how many items each symbol represents.
Teach it We know that a symbol represents of the amount. Key = 10 drinks. = Look carefully! How many drinks are there? This is only a glass. This symbol represents 5 drinks. There are 65 drinks. Stem Sentence: The key tells us how many items each symbol represents.
Teach it Lets check! = = = There are 65 drinks. = = = = Stem Sentence: The key tells us how many items each symbol represents.
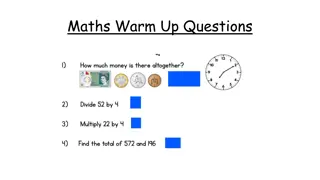
Practise it Emma has drawn a pictogram to show how many children in her class have pets. 30 How many children have cats? 5 How many children have a goldfish? 5 How many more children have rabbits than hamsters? 0. There are the same amount of cats and dogs. How many fewer children have dogs than cats?
Practise it Scott has drawn a pictogram to show how many children in his class have pets. 30 How many children have cats? 5 How many children have a goldfish? 5 How many more children have rabbits than hamsters? 0. There are the same amount of cats and dogs. How many fewer children have dogs than cats?
Do it The pictograms show birds seen in one day. A B = 10 birds. = 5 birds. Robins Robins Pigeon Pigeon Finch Finch Thrush Thrush = 2 people 1. 1. 1. 1. 1. How many Robins were seen? How many Pigeons were seen? How many more Pigeons than Thrushes were seen? How many birds were seen altogether? Which bird was seen the least? Stem Sentence: The key tells us how many items each symbol represents.
Twist it Colin thinks that 4 people like maths. and row. Explain why he is incorrect? Colin is incorrect because Stem Sentence: The key tells us how many items each symbol represents.
Solve it The table and pictogram show the same information. and row. Investigate different ways of completing them. Stem Sentence: The key tells us how many items each symbol represents.
Coming together to feel successful. Confirming the learning. data table headings column most least tally chart pictogram symbol represents What have we learnt? and row. Stem Sentence: The key tells us how many items each symbol represents.