Understanding Pictograms in Statistics: Interpreting Symbolic Representations
Explore the concept of pictograms where symbols represent 5 or 10 items. Learn how to interpret pictograms using keys and symbols, making data visualization easier and quicker. Enhance your understanding through examples and key vocabulary, helping you decode information efficiently.
0 views • 21 slides
Understanding Pictograms: Interpreting Data with Different Scales
Learn how to interpret pictograms with varying scales by solving problems related to hair colors, animals, fruits, ice cream flavors, lollipops, and trees. Practice counting in 2s, 5s, and 10s to determine totals, differences, and combined amounts of different items represented in pictorial form.
0 views • 8 slides
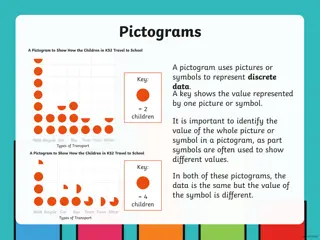
Data Representation Techniques for KS2 Students
Explore different visualization methods such as pictograms, bar charts, and line graphs to help KS2 students understand and interpret data. Learn how to represent travel modes, pet ownership, and temperature variations using visual aids. The content includes examples and questions with answers to te
0 views • 10 slides
Learning Objectives: Using Pictograms to Analyze Data
Dive into today's objectives focusing on using pictograms to answer questions and interpret information. Explore various scenarios involving car counts in a garage and analyze the data presented in pictogram form to draw conclusions. Engage in hands-on activities to practice reading and interpreting
0 views • 16 slides
Understanding Bar Charts and Pictograms in Mathematics
Bar charts and pictograms are visual ways to represent data. It is essential to interpret the key and scale correctly to derive accurate information from the charts. Pay attention to details and calculations to analyze the data effectively.
0 views • 10 slides
CUIMC Laboratory Door Sign Generator Information
The CUIMC Laboratory Door Sign Generator provides instructions for creating door signs for CUIMC 4 x 4 door sign holders. It includes guidelines for different materials used in laboratories and contact information for specific signage needs. The tool offers pre-made text boxes and pictograms to cust
0 views • 8 slides
Hazard Communication in the Workplace
Employers must gather information on the hazards of chemicals they use and communicate this information to workers through training, labeling, and access to Safety Data Sheets (SDSs) as per OSHA Hazard Communication Standard (1910.1200). Hazard Communication Program (HCP) training covers chemical ex
0 views • 20 slides
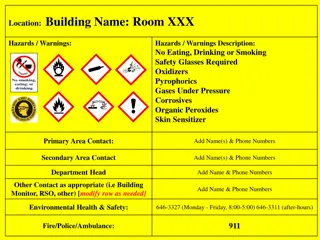
Hazardous Materials Safety Guidelines for Room XXX in Building
This document outlines the hazardous materials safety guidelines for Room XXX in the building, highlighting prohibitions on eating, drinking, and smoking, as well as the requirement for safety glasses. It includes contact information for primary and secondary area contacts, the department head, and
0 views • 4 slides
The Art of Iconography: Conveying Messages Through Symbols
British typographer Margaret Vivienne Calvert revolutionized road sign design with simple yet meaningful pictograms. She created iconic symbols like 'men at work' and 'schoolchildren nearby.' This approach, known as iconography, allows for easy communication of complex messages internationally. Chal
0 views • 13 slides
Understanding Pictograms and Data Interpretation in Mathematics
Explore the fundamentals of interpreting pictograms, understanding data representation, and solving problems involving statistics. Learn how to read and analyze visual data, such as tally charts and pictograms, to extract meaningful information. Practice drawing tallies, comparing numbers, and deter
0 views • 18 slides


