Understanding the Evolution and Functionality of Dashboards
Uncover the history and significance of dashboards, from their origins as horse-drawn carriage protectors to modern-day informational tools. Learn about the purpose, objectives, and importance of dashboards in managing key performance indicators and strategic data for organizations.

Download Presentation

Please find below an Image/Link to download the presentation.
The content on the website is provided AS IS for your information and personal use only. It may not be sold, licensed, or shared on other websites without obtaining consent from the author. Download presentation by click this link. If you encounter any issues during the download, it is possible that the publisher has removed the file from their server.
E N D
Presentation Transcript
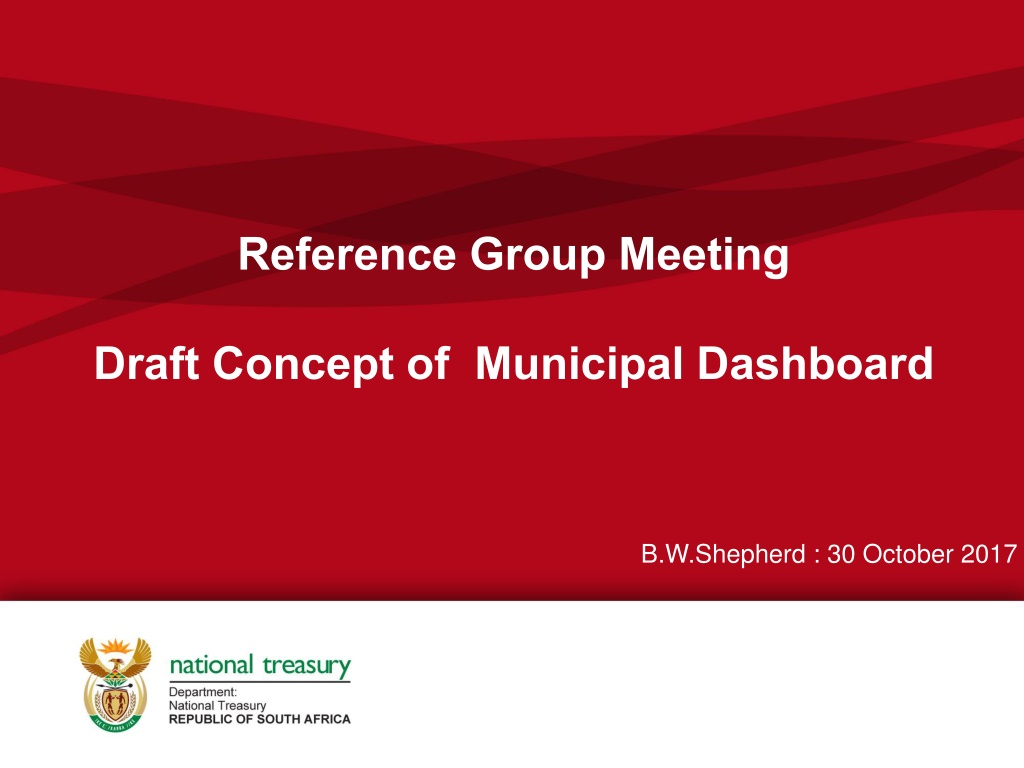
Reference Group Meeting Draft Concept of Municipal Dashboard B.W.Shepherd : 30 October 2017
Content: 1. Original Purpose of a Dashboard 2. Objective of a Dashboard 3. Proposed Municipal Dashboard 4. Project Plan 3
Original Purpose of a Dashboard Originally, the word dashboard applied to a barrier of wood or leather fixed at the front of a horse-drawn carriage or sleigh to protect the driver from mud or other debris "dashed up" (thrown up) by the horses' hooves.[1]Commonly these boards did not perform any additional function other than providing a convenient handhold for ascending into the driver's seat, or a small clip with which to secure the reins when not in use. When the first "horseless carriages" were constructed in the late 19th century, with engines mounted beneath the driver such as the Daimler Stahlradwagen, the simple dashboard was retained to protect occupants from debris thrown up by the cars' front wheels. However, as car design evolved to position the motor in front of the driver, the dashboard became a panel that protected vehicle occupants from the heat and oil of the engine. With gradually increasing mechanical complexity, this panel formed a convenient location for the placement of gauges and minor controls, and from this evolved the modern instrument panel, although retaining its archaic common name. 4
Original Purpose of a Dashboard The dashboard is a wealth of information. It tells you when something is wrong by warning you with an electrical signal. These alerts should never be ignored as some of these could indicate a serious or potentially serious malfunction. But what do they all mean and what do you do when this happens? Icons and meanings are not universal therefore different manufacturers will use different symbols. Here we give you a basic overview of some of the more common dashboard signals. . The Colours on a Dashboard Red or Flashing Potentially serious and you should have the issue seen to as soon as possible. Amber (yellow or orange) Could need servicing or repairs soon Green/Blue Operating or activated signal 5 5
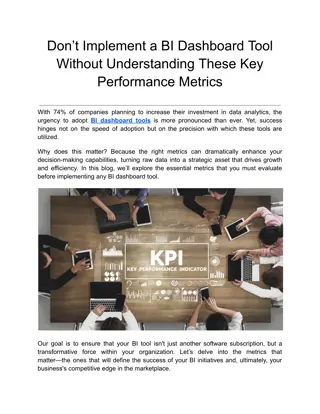
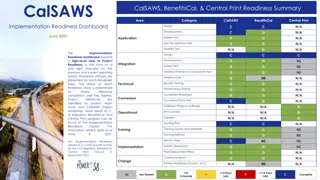
Objective of a Dashboard What is the purpose of a dashboard? The whole point of the web-based dashboard is that it lets you visualize the Key Performance Indicators and other strategic data for your organization at a glance. It is the dashboard tool that presents management with the information for the practical end of the organization. What are dashboards for? A data dashboard is an information management tool that visually tracks, analyses and displays key performance indicators (KPI), metrics and key data points to monitor the health of a business, department or specific process. They are customizable to meet the specific needs of a department and Entity. 7
Objective of a Dashboard Why do we use dashboards? A business dashboard is an information management tool that is used to track KPIs, metrics, and other key data points relevant to a business, department, or specific process. Through the use of data visualizations, dashboards simplify complex data sets to provide users with at a glance awareness of current performance. What is a management dashboard? Dashboards often provide at-a-glance views of KPIs (key performance indicators) relevant to a particular objective or business process (e.g. sales, marketing, human resources, or production). In real-world terms, "dashboard" is another name for "progress report" or "report." 8 8
Draft Concept of a Municipal Dashboard The dashboard should be a multi tier dashboard designed to serve different types of users . The user could be external (Public/ rate payers & Possible Investors) The user could be internal , then the purpose of the information will depend on the level of decision making . Ideally the dashboard should be web-based and updated daily (real time) Here we would like to see as the user signs on in the morning the dashboard appears with the relevant indicators before access is further allowed . 9 9
Multi-Tier Dashboard Executive Mayor and Councillors Municipal Manager Chief Financial Officer Engineering Services Community Services SDBIP GL IDP Sub Ledgers Other Systems Information / data source 10 10
Financial Tier Dashboard Historical Data Non financial data Current Transactions Indicators Registers Financial Statements Functional Areas Cash Flow Eg: Receipting Approved Budgets Debtors Eg: Payroll Creditors Eg: Budget Budget Performance Financial Ratios 11 11
Sugested Project Plan 1.Establish Working Group Finalise Draft terms of reference Invite cross functional Members 2. Meeting of working Group Agree to terms of reference Consensus on dash board Consensus on indicators 3. Present Dashboard Concept for Approval 4. Develop dash board prototype for workshop 5. Implement Dashboard Select Pilot sites Roll out dashboard to All Municipalities 12 12
Discussion: 13 13