Supply in Economics
3b - Supply
This web quiz may appear as two pages on
tablets and laptops.
I recommend that you view it as one page by
clicking on the open book icon at the
bottom of the page.
TOPICS
–
Definition of supply
–
Changes in Supply vs. Changes in Quantity
Supplied
–
Non-price determinants of supply and how they
affect the supply curve
The Supply Curve:
Define, Draw, Describe, Determinants
3b – Supply
3b - Supply
Must Know / Outcomes (1):
•
define supply (note: it has a DIFFERENT DEFINITION in economics)
•
be able to correctly draw and label a supply graph
•
if the price of pizza goes up why does the supply not change?
•
why do economists employ the ceteris paribus assumption when
creating a supply curve?
•
what is the law of supply?
•
why is the supply curve upward sloping (two explanations)
•
list the non-price determinants of supply (Pe, Pog, Pres, Tech,
Taxes, Nprod) or (P,P,P,T,T,N) and understand how they affect the
supply schedule and curve. This is VERY IMPORTANT. BE ABLE TO
DO THIS! See the 3a/3b/3c yellow pages.
•
explain the difference between the a "change in the quantity
supplied" and a "change in supply"
•
what is an increase in supply and a decrease in supply and show
how they affect the supply schedule and the supply curve
•
what is "market supply"?
3b - Supply
Must Know / Outcomes (2):
•
Read the following and answer these questions:
–
Which determinant has changed?
–
Will it affect S or D of gasoline?
–
Will the S or D of gasoline increase or decrease? Shift
to the right or to the left? "According to the Lundberg
Survey, the average price for regular gasoline dropped
3.99 cents over the three weeks up to July 11 to
$3.6699 per gallon. . . . Lundberg explained that the
average gasoline price continues to decrease because
refiners, enjoying the lower crude oil prices in the
market, are passing down the savings to the
consumers. "
–
From:
http://www.techtimes.com/articles/10378/20140714/
average-price-of-gasoline-in-u-s-drops-four-cents-
now-at-3-67-a-gallon.htm
3b - Supply
KEY TERMS:
supply,
quantity supplied,
market supply,
law of supply,
change in supply,
change in quantity supplied,
increase in supply,
decrease in supply,
non-price determinants of supply
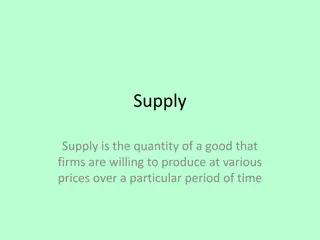
1. DEFINE -- Supply is:
1.
A mathematical representation of the quantity of
a good that a supplier will put on the market
2.
A schedule showing the amount of a good that
consumers are willing to buy at various prices
3.
A schedule showing the amount of a good that
producers are willing to sell at various prices
4.
The amount of a good that is available for sale
For all graphs:
–
Define
–
Draw
–
Describe
1. DEFINE -- Supply is:
1.
A mathematical representation of the quantity of a
good that a supplier will put on the market
2.
A schedule showing the amount of a good that
consumers are willing to buy at various prices
3.
A schedule showing the amount of a good that
producers are willing to sell at various prices
4.
The amount of a good that is available for sale
For all graphs:
–
Define
–
Draw
–
Describe
DRAW – Supply – YP 37
For all graphs:
–
Define
–
Draw
–
Describe
Law of Supply:
the direct relationship between
price and quantity supplied
2. DESCRIBE -- Why will businesses produce more
ONLY if the price increases:
1.
Producers’ costs of producing that good falls
2.
Producers’ costs of producing that good
increases
3.
Consumers demand more so producers must
raise the price
4.
Consumers demand less so producers must
raise the price
For all graphs:
–
Define
–
Draw
–
Describe
Law of Supply:
There is a
direct
relationship
between
price and quantity
supplied.
2. DESCRIBE -- Why will businesses produce
more ONLY if the price increases:
1.
Producers’ costs of producing that good falls
2.
Producers’ costs of producing that good
increases
3.
Consumers demand more so producers must
raise the price
4.
Consumers demand less so producers must
raise the price
For all graphs:
–
Define
–
Draw
–
Describe
Law of Supply:
There is a
direct
relationship
between
price and quantity
supplied.
3. As the price of apples increases,
apple growers will:
1.
Decrease the supply of apples
2.
Increase the supply of apples
3.
Switch to less expensive methods
of production
4.
Increase the quantity of apples
supplied
3. As the price of apples increases,
apple growers will:
1.
Decrease the supply of apples
2.
Increase the supply of apples
3.
Switch to less expensive methods
of production
4.
Increase the quantity of apples
supplied
Change in Quantity Supplied
A change is quantity supplied is caused by a change in the price of the product.
Change in Quantity Supplied vs. Change in Supply
A CHANGE IN QUANTITY SUPPLIED is caused by a
change in the price of the product.
(Px)
A CHANGE IN SUPPLY is caused by a change in the
non-price determinants of supply.
(PPPTTN)
•
Pe -- expected price
•
Pog -- price of other goods
produced by the same firm
•
Pres -- price of resources
•
T -- technology
•
T -- taxes and subsidies
•
N -- number of sellers
Change in Supply – YP 41
Increase in
Supply:
Decrease in
supply:
Change in Quantity Supplied
vs.
Change in Supply
Change in
Quantity
Supplied:
Change in
Supply:
Do YP 39
4. Which of the following will
not
shift the supply curve of product X?
1.
A change in the price of resources
used to produce X
2.
A change in the price of other goods
also produced by the makers of X
3.
A change in the technology used to
produce X
4.
A change in the price of X
4. Which of the following will
not
shift the supply curve of product X?
1.
A change in the price of resources
used to produce X
2.
A change in the price of other goods
also produced by the makers of X
3.
A change in the technology used to
produce X
4.
A change in the price of X
Non-Price Determinants of Supply
( P, P, P, T, T, N )
•
Pe -- expected price
•
Pog -- price of other goods
produced by the
same firm
•
Pres -- price of resources
•
T -- technology
•
T -- taxes and subsidies
•
N -- number of sellers
Cause the Supply Curve to Shift = A Change in Supply
YP 40, 42
5. The supply curve of apples
will shift to the right if:
1.
Very bad weather afflicts the apple-growing areas of
the country
2.
Apples are rumored to have been treated with
cancer-causing insecticides
3.
The government required that all employees in
apple orchards are given more health benefits
4.
Fruit growers see the price of pears decreasing
permanently
6. If a pretzel maker hears rumors
that pretzel prices will fall at the
end of the month, the firm
now
:
1.
Saves it supply for selling at a future date
2.
Increases the supply
3.
Decreases the supply
4.
Waits to supply pretzels when the market is
more stable
6. If a pretzel maker hears rumors
that pretzel prices will fall at the
end of the month, the firm
now
:
1.
Saves it supply for selling at a future date
2.
Increases the supply
3.
Decreases the supply
4.
Waits to supply pretzels when the market is
more stable
7. Which of the following will
cause a decrease in the
market supply for ice cream?
1.
An increase in the price of ice cream
2.
A decrease in the price of ice cream
3.
An increase in the price of milk used to make
ice cream
4.
An expectation that the price of ice cream will
be lower in the future
7. Which of the following will
cause a decrease in the
market supply for ice cream?
1.
An increase in the price of ice cream
2.
A decrease in the price of ice cream
3.
An increase in the price of milk used to make
ice cream
4.
An expectation that the price of ice cream will
be lower in the future
8. An improvement in
production technology will:
1.
Shift the demand curve to the left
2.
Shift the supply curve to the left
3.
Shift the demand curve to the right
4.
Shift the supply curve to the right
8. An improvement in
production technology will:
1.
Shift the demand curve to the left
2.
Shift the supply curve to the left
3.
Shift the demand curve to the right
4.
Shift the supply curve to the right
9. Refer to the table. In
relation to column (1), a
change from column (2) to
column (3) would most
likely be caused by:
1.
Government reducing the tax on the good
2.
Expectations of higher future prices
3.
An increase in consumer incomes
4.
An increase in input prices
9. Refer to the table. In
relation to column (1), a
change from column (2) to
column (3) would most
likely be caused by:
1.
Government reducing the tax on the good
2.
Expectations of higher future prices
3.
An increase in consumer incomes
4.
An increase in input prices
10. The market supply of a
good or service:
1.
Is the sum of the individual supply curves
2.
Is determined by all the determinants of
individual supply and by the number of
producers
3.
Reflects a direct relationship between price
and quantity supplied
4.
All of the above
10. The market supply of a
good or service:
1.
Is the sum of the individual supply curves
2.
Is determined by all the determinants of
individual supply and by the number of
producers
3.
Reflects a direct relationship between price
and quantity supplied
4.
All of the above
Market Supply
Explore the definition of supply, changes in supply versus changes in quantity supplied, non-price determinants of supply, the supply curve, key outcomes to know, and real-world examples affecting gasoline supply. Develop a strong foundation in economic concepts with detailed explanations and graphical representations.

Download Presentation

Please find below an Image/Link to download the presentation.
The content on the website is provided AS IS for your information and personal use only. It may not be sold, licensed, or shared on other websites without obtaining consent from the author.If you encounter any issues during the download, it is possible that the publisher has removed the file from their server.
You are allowed to download the files provided on this website for personal or commercial use, subject to the condition that they are used lawfully. All files are the property of their respective owners.
The content on the website is provided AS IS for your information and personal use only. It may not be sold, licensed, or shared on other websites without obtaining consent from the author.
E N D
Presentation Transcript
3b - Supply This web quiz may appear as two pages on tablets and laptops. I recommend that you view it as one page by clicking on the open book icon at the bottom of the page.
3b Supply TOPICS Definition of supply Changes in Supply vs. Changes in Quantity Supplied Non-price determinants of supply and how they affect the supply curve The Supply Curve: Define, Draw, Describe, Determinants
3b - Supply Must Know / Outcomes (1): define supply (note: it has a DIFFERENT DEFINITION in economics) be able to correctly draw and label a supply graph if the price of pizza goes up why does the supply not change? why do economists employ the ceteris paribus assumption when creating a supply curve? what is the law of supply? why is the supply curve upward sloping (two explanations) list the non-price determinants of supply (Pe, Pog, Pres, Tech, Taxes, Nprod) or (P,P,P,T,T,N) and understand how they affect the supply schedule and curve. This is VERY IMPORTANT. BE ABLE TO DO THIS! See the 3a/3b/3c yellow pages. explain the difference between the a "change in the quantity supplied" and a "change in supply" what is an increase in supply and a decrease in supply and show how they affect the supply schedule and the supply curve what is "market supply"?
3b - Supply Must Know / Outcomes (2): Read the following and answer these questions: Which determinant has changed? Will it affect S or D of gasoline? Will the S or D of gasoline increase or decrease? Shift to the right or to the left? "According to the Lundberg Survey, the average price for regular gasoline dropped 3.99 cents over the three weeks up to July 11 to $3.6699 per gallon. . . . Lundberg explained that the average gasoline price continues to decrease because refiners, enjoying the lower crude oil prices in the market, are passing down the savings to the consumers. " From: http://www.techtimes.com/articles/10378/20140714/ average-price-of-gasoline-in-u-s-drops-four-cents- now-at-3-67-a-gallon.htm
3b - Supply KEY TERMS: supply, quantity supplied, market supply, law of supply, change in supply, change in quantity supplied, increase in supply, decrease in supply, non-price determinants of supply
1. DEFINE -- Supply is: 1. A mathematical representation of the quantity of a good that a supplier will put on the market 2. A schedule showing the amount of a good that consumers are willing to buy at various prices 3. A schedule showing the amount of a good that producers are willing to sell at various prices 4. The amount of a good that is available for sale For all graphs: Define Draw Describe
1. DEFINE -- Supply is: 1. A mathematical representation of the quantity of a good that a supplier will put on the market 2. A schedule showing the amount of a good that consumers are willing to buy at various prices 3. A schedule showing the amount of a good that producers are willing to sell at various prices 4. The amount of a good that is available for sale For all graphs: Define Draw Describe
DRAW Supply YP 37 For all graphs: Define Draw Describe Law of Supply: the direct relationship between price and quantity supplied
2. DESCRIBE -- Why will businesses produce more ONLY if the price increases: 1. Producers costs of producing that good falls 2. Producers costs of producing that good increases 3. Consumers demand more so producers must raise the price 4. Consumers demand less so producers must raise the price For all graphs: Define Draw Describe Law of Supply: There is a direct relationship between price and quantity supplied.
2. DESCRIBE -- Why will businesses produce more ONLY if the price increases: 1. Producers costs of producing that good falls 2. Producers costs of producing that good increases 3. Consumers demand more so producers must raise the price 4. Consumers demand less so producers must raise the price For all graphs: Define Draw Describe Law of Supply: There is a direct relationship between price and quantity supplied.
3. As the price of apples increases, apple growers will: 1. Decrease the supply of apples 2. Increase the supply of apples 3. Switch to less expensive methods of production 4. Increase the quantity of apples supplied
3. As the price of apples increases, apple growers will: 1. Decrease the supply of apples 2. Increase the supply of apples 3. Switch to less expensive methods of production 4. Increase the quantity of apples supplied
Change in Quantity Supplied A change is quantity supplied is caused by a change in the price of the product.
Change in Quantity Supplied vs. Change in Supply A CHANGE IN QUANTITY SUPPLIED is caused by a change in the price of the product. (Px) A CHANGE IN SUPPLY is caused by a change in the non-price determinants of supply. (PPPTTN) Pe -- expected price Pog -- price of other goods produced by the same firm Pres -- price of resources T -- technology T -- taxes and subsidies N -- number of sellers
Change in Supply YP 41 Increase in Supply: Decrease in supply:
Change in Quantity Supplied vs. Change in Supply Change in Quantity Supplied: Change in Supply: Do YP 39
4. Which of the following will not shift the supply curve of product X? 1. A change in the price of resources used to produce X 2. A change in the price of other goods also produced by the makers of X 3. A change in the technology used to produce X 4. A change in the price of X
4. Which of the following will not shift the supply curve of product X? 1. A change in the price of resources used to produce X 2. A change in the price of other goods also produced by the makers of X 3. A change in the technology used to produce X 4. A change in the price of X
Non-Price Determinants of Supply ( P, P, P, T, T, N ) Pe -- expected price Pog -- price of other goods produced by the same firm Pres -- price of resources T -- technology T -- taxes and subsidies N -- number of sellers Cause the Supply Curve to Shift = A Change in Supply YP 40, 42
5. The supply curve of apples will shift to the right if: 1. Very bad weather afflicts the apple-growing areas of the country Apples are rumored to have been treated with cancer-causing insecticides The government required that all employees in apple orchards are given more health benefits Fruit growers see the price of pears decreasing permanently 2. 3. 4.
5. The supply curve of apples will shift to the right if: 1. Very bad weather afflicts the apple-growing areas of the country Apples are rumored to have been treated with cancer-causing insecticides The government required that all employees in apple orchards are given more health benefits Fruit growers see the price of pears decreasing permanently 2. 3. 4.
6. If a pretzel maker hears rumors that pretzel prices will fall at the end of the month, the firm now: 1. Saves it supply for selling at a future date 2. Increases the supply 3. Decreases the supply 4. Waits to supply pretzels when the market is more stable
6. If a pretzel maker hears rumors that pretzel prices will fall at the end of the month, the firm now: 1. Saves it supply for selling at a future date 2. Increases the supply 3. Decreases the supply 4. Waits to supply pretzels when the market is more stable
7. Which of the following will cause a decrease in the market supply for ice cream? 1. An increase in the price of ice cream 2. A decrease in the price of ice cream 3. An increase in the price of milk used to make ice cream 4. An expectation that the price of ice cream will be lower in the future
7. Which of the following will cause a decrease in the market supply for ice cream? 1. An increase in the price of ice cream 2. A decrease in the price of ice cream 3. An increase in the price of milk used to make ice cream 4. An expectation that the price of ice cream will be lower in the future
8. An improvement in production technology will: 1. Shift the demand curve to the left 2. Shift the supply curve to the left 3. Shift the demand curve to the right 4. Shift the supply curve to the right
8. An improvement in production technology will: 1. Shift the demand curve to the left 2. Shift the supply curve to the left 3. Shift the demand curve to the right 4. Shift the supply curve to the right
9. Refer to the table. In relation to column (1), a change from column (2) to column (3) would most likely be caused by: 1. Government reducing the tax on the good 2. Expectations of higher future prices 3. An increase in consumer incomes 4. An increase in input prices
9. Refer to the table. In relation to column (1), a change from column (2) to column (3) would most likely be caused by: 1. Government reducing the tax on the good 2. Expectations of higher future prices 3. An increase in consumer incomes 4. An increase in input prices
10. The market supply of a good or service: 1. Is the sum of the individual supply curves 2. Is determined by all the determinants of individual supply and by the number of producers 3. Reflects a direct relationship between price and quantity supplied 4. All of the above
10. The market supply of a good or service: 1. Is the sum of the individual supply curves 2. Is determined by all the determinants of individual supply and by the number of producers 3. Reflects a direct relationship between price and quantity supplied 4. All of the above