Supply in Economics
Supply
Supply is the quantity of a good that
firms are willing to produce at various
prices over a particular period of time
Law of Supply
•
all other factors being equal, as the price of a
good or service increases, the quantity of
goods or services offered by suppliers
increases and vice versa
•
A firm is willing to produce more goods at €2
as opposed to €1
•
Individual supply – refers to the quantity of a
good supplied by an individual firm at different
prices
•
Market/aggregate supply – refers to the quantity
of a good supplied by all the firms in the market
at different prices (add all the individual supply)
•
Supply Schedule – table that shows the different
quantities of a good made available for sale at
various market prices at any given time
•
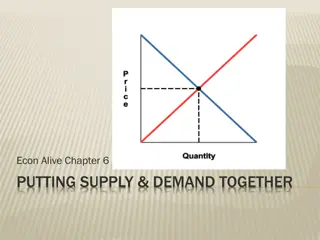
Supply curve – graph that illustrates the number
of units of a good made available for sale at
various market prices at any given time. There is a
positive relationship between price and quantity.
Upward sloping from left to right.
•
Individual supply curve – supply curve of one firm
•
Market supply curve – supply curve of all the
firms within a market
Example
•
Fill in the Individual supply curves and Market
supply curve
Other circumstances of Supply
•
Supply restricted by a minimum market price
•
Supply restricted by limited capacity
•
Fixed Supply
Supply restricted by a minimum
market price
•
In in order to stay in production in the long
run, firms have to cover their costs
•
So some goods may not be supplied if the
market price is below a certain minimum price
•
Any price below this level would result in the
firm in making a loss
•
So no producer would enter the market until
this minimum price is reached
Gardening centre
Seeds, 10c
Pot, 50c
Wages per unit, €3
Plant food and water, €1
Total Cost €4.60
Supply restricted by limited capacity
•
An industries capacity to supply a good may
be limited
•
This could be due to productive capacity,
shortage of specialised labour or shortage of
raw materials
•
Once the maximum capacity is reached, the
quantity supplied remains the same no matter
what the price is
Garden centre might be only able to stock 10,000 plants
which means that it cannot hold any more goods
available for sale
As a result supply is restricted
Fixed Supply
•
Fixed supply occurs when the supply of a
product cannot be changed in the short run
no matter what the price
•
Examples include perishable goods (Fish) the
supply of land or the capacity of a stadium
20,000 tickets for a football match but there is a
demand for 60,000 tickets
If there are only 20,000 seats in the stadium then
no matte what the price is offered for tickets, the
supply of seats is fixed
Movements along the supply curve
•
A movement along the supply curve is caused
by a change in the price of the good or service
•
In general, suppliers are willing to produce
more of a product at higher prices and less at
lower prices
•
An increase in the price of a good will result in
an increase in the quantity supplied
•
A decrease in the price of a good will result in
a decrease in the quantity supplied
Shift in the supply curve
•
A shift in the supply curve is caused by a
change in any non-price determinant of
supply
•
A shift in the supply curve illustrates the
different quantities supplied at the same price
•
The curve can shift to the left or to the right
Shift in the supply curve
Factors that affect the supply of a good
•
Price of the good
•
Price of other related goods
•
Cost of production
•
Factors outside the control of the firm
•
State of technology
•
Taxation and subsidies
•
Objectives of the firm
•
Numbers of firm in industry
Price of the good
•
If there is a rise in the
price of a good, the
quantity supplied will
also increase
•
more profitable for the
firm to supply the
goods at a higher price
Price of related goods
•
From the aspect of supply – price of a related
good refers to the other goods that the supplier
could produce as an alternative to those currently
being produced
•
If the price of a related good rises, irrespective of
whether the price of the good the firm is
currently producing remains the same, or falls, it
will become a much more attractive and
profitable alternative to switch resources to the
production of the related good. E.g. tablets and
laptops
Price of related goods
•
Computer manufacturer – may find out that
the price of tablets are increasing while
laptops remain constant
•
Tablets more attractive to produce
•
Company will then move resources away from
the production of laptops to the production of
tablets
Cost of production
•
A supplier combines raw materials, capital and
labour to produce the output they supply
•
If there is an increase in these costs it will be
more expensive to manufacture these goods
•
The firm will not continue to supply the same
quantity of the good at the old price so there
will be a reduction in the quantity supplied
•
Increase in cost of
production
–
Rise in labour cost
–
Rise in material cost
–
Increase in taxes
–
Decrease in subsidies
•
Decrease on cost of
production
–
Fall in labour cost
–
Fall in material cost
–
Decrease in taxes
–
Increase in subsidies
Technology
•
Technology is a cost reducing innovation
•
Progress allows firms to produce at a lower
cost
•
Computers
•
Telecommunications
Taxes and Subsidies
•
Reduction in taxes, increase in subsidies
•
Increase in taxes, decrease in subsidies
Objective of firm
•
Firm changes from one that of profit
maximisation to satisfactory profit
•
B&B Owner – open 7 nights a week, not
enough family time
•
Decides to close B&B for a few days of the
week for family time
Number of sellers in the industry
Supply in economics refers to the quantity of goods that firms are willing to produce at different prices over a specific period. The Law of Supply states that as prices increase, the quantity supplied by firms also increases. Individual and market supply curves illustrate this relationship, with other circumstances such as supply restrictions impacting production levels.

Download Presentation

Please find below an Image/Link to download the presentation.
The content on the website is provided AS IS for your information and personal use only. It may not be sold, licensed, or shared on other websites without obtaining consent from the author.If you encounter any issues during the download, it is possible that the publisher has removed the file from their server.
You are allowed to download the files provided on this website for personal or commercial use, subject to the condition that they are used lawfully. All files are the property of their respective owners.
The content on the website is provided AS IS for your information and personal use only. It may not be sold, licensed, or shared on other websites without obtaining consent from the author.
E N D
Presentation Transcript
Supply Supply is the quantity of a good that firms are willing to produce at various prices over a particular period of time
Law of Supply all other factors being equal, as the price of a good or service increases, the quantity of goods or services offered by suppliers increases and vice versa A firm is willing to produce more goods at 2 as opposed to 1
Individual supply refers to the quantity of a good supplied by an individual firm at different prices Market/aggregate supply refers to the quantity of a good supplied by all the firms in the market at different prices (add all the individual supply) Supply Schedule table that shows the different quantities of a good made available for sale at various market prices at any given time
Supply curve graph that illustrates the number of units of a good made available for sale at various market prices at any given time. There is a positive relationship between price and quantity. Upward sloping from left to right. Individual supply curve supply curve of one firm Market supply curve supply curve of all the firms within a market
Example Fill in the Individual supply curves and Market supply curve
Other circumstances of Supply Supply restricted by a minimum market price Supply restricted by limited capacity Fixed Supply
Supply restricted by a minimum market price In in order to stay in production in the long run, firms have to cover their costs So some goods may not be supplied if the market price is below a certain minimum price Any price below this level would result in the firm in making a loss So no producer would enter the market until this minimum price is reached
Gardening centre Seeds, 10c Pot, 50c Wages per unit, 3 Plant food and water, 1 Total Cost 4.60
Supply restricted by limited capacity An industries capacity to supply a good may be limited This could be due to productive capacity, shortage of specialised labour or shortage of raw materials Once the maximum capacity is reached, the quantity supplied remains the same no matter what the price is
Garden centre might be only able to stock 10,000 plants which means that it cannot hold any more goods available for sale As a result supply is restricted
Fixed Supply Fixed supply occurs when the supply of a product cannot be changed in the short run no matter what the price Examples include perishable goods (Fish) the supply of land or the capacity of a stadium
20,000 tickets for a football match but there is a demand for 60,000 tickets If there are only 20,000 seats in the stadium then no matte what the price is offered for tickets, the supply of seats is fixed
Movements along the supply curve A movement along the supply curve is caused by a change in the price of the good or service In general, suppliers are willing to produce more of a product at higher prices and less at lower prices An increase in the price of a good will result in an increase in the quantity supplied A decrease in the price of a good will result in a decrease in the quantity supplied
Shift in the supply curve A shift in the supply curve is caused by a change in any non-price determinant of supply A shift in the supply curve illustrates the different quantities supplied at the same price The curve can shift to the left or to the right
Factors that affect the supply of a good Price of the good Price of other related goods Cost of production Factors outside the control of the firm State of technology Taxation and subsidies Objectives of the firm Numbers of firm in industry
Price of the good If there is a rise in the price of a good, the quantity supplied will also increase more profitable for the firm to supply the goods at a higher price
Price of related goods From the aspect of supply price of a related good refers to the other goods that the supplier could produce as an alternative to those currently being produced If the price of a related good rises, irrespective of whether the price of the good the firm is currently producing remains the same, or falls, it will become a much more attractive and profitable alternative to switch resources to the production of the related good. E.g. tablets and laptops
Price of related goods Computer manufacturer may find out that the price of tablets are increasing while laptops remain constant Tablets more attractive to produce Company will then move resources away from the production of laptops to the production of tablets
Cost of production A supplier combines raw materials, capital and labour to produce the output they supply If there is an increase in these costs it will be more expensive to manufacture these goods The firm will not continue to supply the same quantity of the good at the old price so there will be a reduction in the quantity supplied
Decrease on cost of production Fall in labour cost Fall in material cost Decrease in taxes Increase in subsidies Increase in cost of production Rise in labour cost Rise in material cost Increase in taxes Decrease in subsidies
Technology Technology is a cost reducing innovation Progress allows firms to produce at a lower cost Computers Telecommunications
Taxes and Subsidies Reduction in taxes, increase in subsidies Increase in taxes, decrease in subsidies
Objective of firm Firm changes from one that of profit maximisation to satisfactory profit B&B Owner open 7 nights a week, not enough family time Decides to close B&B for a few days of the week for family time