Supply and Demand in Economics

 undefined

1
Demand is the amount of a good or service that
buyers are willing and able to buy at all prices
during some time period. The demand curve
depicts the demand for a good or service.
2
The equation for this graph is
P = a – b Q
a is the intercept on the
Price or (y) axis and b is the
gradient of the graph
The supply curve depicts the supply of a good or
service. It shows th
e quantity of a good or service
that producers are willing and able to sell at all
possible prices during some time period.
3
The equation for this graph is
P = a + b Q
a is the intercept on the
Price or (y) axis and b is the
gradient of the graph
Factors other than the price of a good or service
that change (shift) the demand schedule, causing
consumers to buy more or less at every price.
4
•
Change in income
: With a higher income (lower
income) consumers are willing and able to buy more
(less) of a product at every price.
•
Change in tastes or preferences
: If a study reveals
that cookies are nutritious, the demand for cookies
probably would increase. If a study found cookies are
harmful, the demand for cookies would probably
decrease.
•
The number of consumers in the market is a demand.
5
Change in the price of complementary goods. If the price
of hot chocolate increases, people will drink less hot
chocolate and may buy fewer cookies to eat with hot
chocolate. As a result, the demand for cookies decreases.
If the price of hot chocolate decreases, people will drink
more hot chocolate and will buy more cookies to eat with
hot chocolate, so the demand for cookies will increase.
Change in the price of substitute goods. If the price of
eggs goes up, consumers may substitute cereal for
breakfast. As a result the demand for cereal will increase.
If the price of eggs decreases, please may eat less cereal.
As a result the demand for cereal decreases.
6
Factors other than the price of a good or service
that change (shift) the supply schedule, causing
producers to supply more or less at every price.
7
Greater the number of sellers, greater will be
the quantity of a product or service supplied in a
market and vice versa. Thus increase in number
of sellers will increase supply and shift the supply
curve rightwards whereas decrease in number of
sellers will decrease the supply and shift the
supply curve leftwards. For example, when more
firms enter an industry, the number of sellers
increases thus increasing the supply.
8
Termsexplained.com
A newly released study shows
that battery-operated toys
harm a child's development.
How will this affect the market
for battery-operated toys?
9
Due to a price hike the wages
of laborers on wheat farms
increased by 10% over the last
year.
How could this affect the
wheat market?
10
The price of iPhones decreases.
What will be the effect on the
market for sim cards used in
iPhones?
11
The world price of low grade
coal, used to generate
electricity, increased drastically
in the last 3 months.
How could this possibly affect
the market for household gas?
12
A more efficient way to trap
crabs has been invented.
What will be the affect on the
market for tinned crab meat?
13
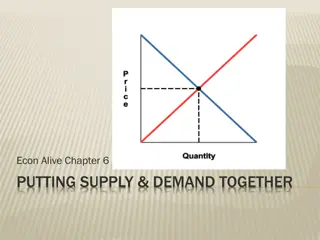
Supply and demand are fundamental concepts in economics. Demand is the quantity of a good buyers are willing and able to purchase at various prices, while supply is the quantity of a good producers are willing to sell at different prices. Factors like income changes, taste preferences, and prices of complementary or substitute goods influence both demand and supply. More sellers in a market typically lead to a greater quantity supplied. These dynamics affect pricing and market equilibrium.

Download Presentation

Please find below an Image/Link to download the presentation.
The content on the website is provided AS IS for your information and personal use only. It may not be sold, licensed, or shared on other websites without obtaining consent from the author.If you encounter any issues during the download, it is possible that the publisher has removed the file from their server.
You are allowed to download the files provided on this website for personal or commercial use, subject to the condition that they are used lawfully. All files are the property of their respective owners.
The content on the website is provided AS IS for your information and personal use only. It may not be sold, licensed, or shared on other websites without obtaining consent from the author.
E N D
Presentation Transcript
Demand is the amount of a good or service that buyers are willing and able to buy at all prices during some time period. The demand curve depicts the demand for a good or service. a Price The equation for this graph is P = a b Q P a is the intercept on the Price or (y) axis and b is the gradient of the graph Q Quantity 2
The supply curve depicts the supply of a good or service. It shows the quantity of a good or service that producers are willing and able to sell at all possible prices during some time period. Price The equation for this graph is P = a + b Q P a is the intercept on the Price or (y) axis and b is the gradient of the graph a Q Quantity 3
Factors other than the price of a good or service that change (shift) the demand schedule, causing consumers to buy more or less at every price. 4
Change in income: With a higher income (lower income) consumers are willing and able to buy more (less) of a product at every price. Change in tastes or preferences: If a study reveals that cookies are nutritious, the demand for cookies probably would increase. If a study found cookies are harmful, the demand for cookies would probably decrease. The number of consumers in the market is a demand. 5
Change in the price of complementary goods. If the price of hot chocolate increases, people will drink less hot chocolate and may buy fewer cookies to eat with hot chocolate. As a result, the demand for cookies decreases. If the price of hot chocolate decreases, people will drink more hot chocolate and will buy more cookies to eat with hot chocolate, so the demand for cookies will increase. Change in the price of substitute goods. If the price of eggs goes up, consumers may substitute cereal for breakfast. As a result the demand for cereal will increase. If the price of eggs decreases, please may eat less cereal. As a result the demand for cereal decreases. 6
Factors other than the price of a good or service that change (shift) the supply schedule, causing producers to supply more or less at every price. 7
Greater the number of sellers, greater will be the quantity of a product or service supplied in a market and vice versa. Thus increase in number of sellers will increase supply and shift the supply curve rightwards whereas decrease in number of sellers will decrease the supply and shift the supply curve leftwards. For example, when more firms enter an industry, the number of sellers increases thus increasing the supply. 8 Termsexplained.com
A newly released study shows that battery-operated toys harm a child's development. How will this affect the market for battery-operated toys? 9
Due to a price hike the wages of laborers on wheat farms increased by 10% over the last year. How could this affect the wheat market? 10
The price of iPhones decreases. What will be the effect on the market for sim cards used in iPhones? 11
The world price of low grade coal, used to generate electricity, increased drastically in the last 3 months. How could this possibly affect the market for household gas? 12
A more efficient way to trap crabs has been invented. What will be the affect on the market for tinned crab meat? 13