Supply and Demand in Economics


Session 4
Supply and Demand
Disclaimer: The views expressed are those of the presenters and do not necessarily reflect those
of the Federal Reserve Bank of Dallas or the Federal Reserve System.
TEKS
(2) Economics. The student understands the
interaction of supply, demand, and price. The
student is expected to:
(A) understand the effect of changes in price on the
quantity demanded and quantity supplied;
(B) identify the non-price determinants that create
changes in supply and demand, which result in a new
equilibrium price; and
(C) interpret a supply-and-demand graph using
supply-and-demand schedules.
Teaching the Terms
•
Market
•
Demand
•
Supply
•
Determinants
•
Surplus
•
Shortage
Markets
•
A market facilitates the interaction of a buyer
and a seller as they complete a transaction
•
Buyers
, as a group, determine the
demand
•
Sellers
, as a group, determine the
supply
Characteristics of Competitive Markets
•
Identical goods or services
•
Enough buyers and sellers so that no
participant can influence the market price –
everyone is a
price taker
Demand
•
Law of demand
•
Quantity demanded
•
Demand schedule
•
Demand curve
•
Determinants of demand
The Law of Demand
Demand
Determinants of Demand
•
Income
•
Price of related goods
–
Complements
–
Substitutes
•
Tastes or preferences
•
Expectations
•
Number of buyers
Shifting Demand
Supply
•
Law of supply
•
Quantity supplied
•
Supply schedule
•
Supply curve
•
Determinants of supply
The Law of Supply
Supply
Determinants of Supply
•
Input prices
•
Technology
•
Expectations
•
Number of sellers
Shifting Supply
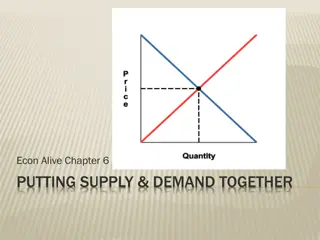
Market Equilibrium
Market Equilibrium
Market Equilibrium
Practice
•
Draw the graph.
•
Which curve is shifting because of the
changing market conditions? Supply?
Demand? Both?
•
Which direction is the shift?
•
Draw the shift.
•
What is the impact on price and quantity?
Price Controls
•
Price Ceiling
–
If price is fixed
BELOW
the market clearing price
–
Creates a shortage because
Q
d
>
Q
s
•
Rent controls
•
Price Floor
–
If price is fixed
ABOVE
the market clearing price
–
Creates a surplus because
Q
d
<
Q
s
•
Minimum wage
Price Elasticity of Demand
•
Measures the responsiveness of quantity
demanded to a change in price
•
Determinants
–
Availability of close substitutes
–
Necessities versus luxuries
–
Definition of the market (food vs. ice cream vs.
chocolate ice cream)
–
Time horizon
Price Elasticity and Total Revenue
•
If demand for a good is elastic, price increases
lead to lower total revenue
•
If demand for a good is inelastic, price
increases lead to higher total revenue
Price Elasticity of Supply
•
Measures the responsiveness of quantity
supplied to a change in price
•
Determinants
–
Availability of inputs
–
Time
Questions?
Exploring the interaction of supply, demand, and price in economics through topics such as market dynamics, characteristics of competitive markets, the law of demand, determinants of demand, and shifting demand. Gain insights into how changes in price and various factors affect supply and demand equilibrium.

Download Presentation

Please find below an Image/Link to download the presentation.
The content on the website is provided AS IS for your information and personal use only. It may not be sold, licensed, or shared on other websites without obtaining consent from the author.If you encounter any issues during the download, it is possible that the publisher has removed the file from their server.
You are allowed to download the files provided on this website for personal or commercial use, subject to the condition that they are used lawfully. All files are the property of their respective owners.
The content on the website is provided AS IS for your information and personal use only. It may not be sold, licensed, or shared on other websites without obtaining consent from the author.
E N D
Presentation Transcript
Session 4 Supply and Demand Disclaimer: The views expressed are those of the presenters and do not necessarily reflect those of the Federal Reserve Bank of Dallas or the Federal Reserve System.
TEKS (2) Economics. The student understands the interaction of supply, demand, and price. The student is expected to: (A) understand the effect of changes in price on the quantity demanded and quantity supplied; (B) identify the non-price determinants that create changes in supply and demand, which result in a new equilibrium price; and (C) interpret a supply-and-demand graph using supply-and-demand schedules.
Teaching the Terms Market Demand Supply Determinants Surplus Shortage
Markets A market facilitates the interaction of a buyer and a seller as they complete a transaction Buyers, as a group, determine the demand Sellers, as a group, determine the supply
Characteristics of Competitive Markets Identical goods or services Enough buyers and sellers so that no participant can influence the market price everyone is a price taker
Demand Law of demand Quantity demanded Demand schedule Demand curve Determinants of demand
The Law of Demand As the price rises, the quantity demand falls.
Demand Demand for ____ Price Quantity 6 $5 $4 $3 $2 $1 10 20 30 40 50 5 4 Price 3 2 1 0 10 20 30 40 50 Quantity
Determinants of Demand Income Price of related goods Complements Substitutes Tastes or preferences Expectations Number of buyers
Shifting Demand 8 7 6 5 Price 4 3 2 1 0 10 20 30 40 50 Quantity
Supply Law of supply Quantity supplied Supply schedule Supply curve Determinants of supply
The Law of Supply As the price rises, the quantity supplied rises.
Supply Supply of ____ Price Quantity 6 $5 $4 $3 $2 $1 50 40 30 20 10 5 4 Price 3 2 1 0 10 20 30 40 50 Quantity
Determinants of Supply Input prices Technology Expectations Number of sellers
Shifting Supply 8 7 6 5 Price 4 3 2 1 0 10 20 30 40 50 Quantity
Market Equilibrium Quantity Demanded 10 20 30 40 50 Quantity Supplied 50 40 30 20 10 Price $5 $4 $3 $2 $1
Market Equilibrium 6 Supply 5 4 Price 3 2 1 Demand 0 10 20 30 40 50 Quantity
Market Equilibrium Quantity demanded is less than quantity supplied Surplus Qd< Qs Quantity demanded is equal to quantity supplied Equilibrium Qd= Qs Quantity demanded is greater than quantity supplied Shortage Qd> Qs
Practice Draw the graph. Which curve is shifting because of the changing market conditions? Supply? Demand? Both? Which direction is the shift? Draw the shift. What is the impact on price and quantity?
Price Controls Price Ceiling If price is fixed BELOW the market clearing price Creates a shortage because Qd> Qs Rent controls Price Floor If price is fixed ABOVE the market clearing price Creates a surplus because Qd< Qs Minimum wage
Price Elasticity of Demand Measures the responsiveness of quantity demanded to a change in price Determinants Availability of close substitutes Necessities versus luxuries Definition of the market (food vs. ice cream vs. chocolate ice cream) Time horizon
Price Elasticity and Total Revenue If demand for a good is elastic, price increases lead to lower total revenue If demand for a good is inelastic, price increases lead to higher total revenue
Price Elasticity of Supply Measures the responsiveness of quantity supplied to a change in price Determinants Availability of inputs Time