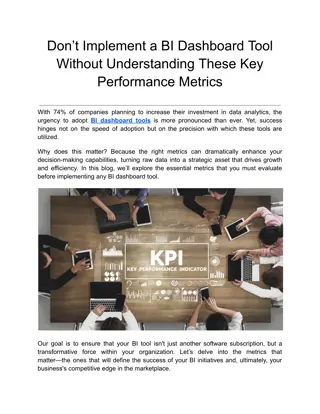
Insights into Views of Climate and Learning VOCAL Dashboard


Views of Climate and Learning
(VOCAL):
Dashboard Demo
July 26, 2022
CONTENTS
01
Views of Climate and Learning (VOCAL):
Context &
New Data Reports
02
PowerBi/Edwin VOCAL Dashboard Demo
03
VOCAL Resources
01
Context & New Data Reports
VOCAL in Context: The CASEL* Wheel
4
Social and Emotional Indicator
System (SELIS)
Measures students’ views of
their 5 core SEL competencies
DESE sponsored:
F151 Grant
Available
Classroom
School
Views of Climate and Learning
(VOCAL)
Measures students’ views of
their school climate
DESE sponsored: MCAS
o
G4/G5:
46 items
o
G8/G10:
48 items
*
Collaborative for Academic and Social and Emotional Learning
5
What does VOCAL* tell us?
It tells us how students view three dimensions
and nine topic areas of school climate: Grades 4, 5, 8, and 10
Engagement
Dimension
o
Culture competence (CLC)
o
Participation (PAR)
o
Relationships (REL)
Environment Dimension
o
Discipline (DIS)
o
Instructional (INS)
o
Mental health (MEN)
Safety Dimension
o
Bullying/cyber-bullying (BUL)
o
Emotional safety (EMO)
o
Physical safety (PSF)
*
Based on U.S. Dept. of Education’s Conceptual Framework
6
New data reports at the school- and student group- level (2022)
Dimension scores (Engagement, Safety, Environment) for student groups (N≥20)
Participation (Engagement Topic) score at school level (N≥50)
o
In my academic classes, students wrestle with problems that don't have an obvious answer. G8
o
In my classes, students teach each other how they solved a problem.
G5
Instructional Environment
(Environment Topic) score at school level (N≥50)
o
Students are given multiple opportunities to show that they have mastered their classwork. G8
o
In my classes, mistakes or even failure on an assignment are viewed as an important part of our learning. G10
Bullying (Safety Topic) score at school level (N≥50)
o
In my school, groups of students tease or pick on one student. G4, G5, G8, G10
o
Teachers, students, and the principal work together to prevent (stop) bullying.
G4, G5, G8, G10
7
New data visualization (+associated narratives): Index/scaled score
distribution divided using 3 cut-points
Overall VOCAL score
used to categorize student views into four scoring groups
3 cut points benchmark and describe student views
(30, 50, and 70)
Reported out
at state-, district-, school-, and grade-level for comparative analyses
VOCAL reporting details:
Report timeline (2023 going forward)
o
Preliminary report:
Late June/early July
o
Final report:
Late September/early October
New reporting format
o
Edwin
(Security Portal)
o
Power BI interface
– graphics, visuals (2018 through 2022…...)
o
Downloads
available using paginated reports for data analyses
8
02
PowerBi/Edwin VOCAL Dashboard Demo
03
VOCAL Resources
Resources and VOCAL webinar
Resources: (note: 2022 state report will be posted in September)
Foreign language translations
o
Brazilian Portuguese, Haitian Creole, Simplified Chinese, Spanish
User guides (
2022
,
2021
,
2019
)
Grade-level School Climate Profiles (
2022
,
2021
,
2019
,
2018
)
State Reports (2022,
2021
,
2019
,
2018
)
Interpretive guide and Action Plan template (
2022
,
2019
,
2018
)
VOCAL Item Crosswalk
(CASEL SEL, PBIS, Accessible Instruction)
Webinars: Invite will be emailed and posted in Commissioner’s Update
September VOCAL Dashboard Webinar for districts/schools (TBD)
September VOCAL data analyses Webinars (Sept. 14; Sept. 29)
11
Thank you!
781-338-3119
Shelagh.Peoples@mass.gov
Shelagh Peoples, Psychometric Coordinator
research
@doe.mass.edu
Explore the VOCAL Dashboard demo and context including data reports on school climate, student engagement, safety, and environment. Understand how students perceive different dimensions and topics, such as bullying, participation, relationships, and more across grades 4, 5, 8, and 10. Dive into new data reports and assessments at both school and student group levels to enhance learning environments and address social and emotional indicators within educational settings.

Download Presentation

Please find below an Image/Link to download the presentation.
The content on the website is provided AS IS for your information and personal use only. It may not be sold, licensed, or shared on other websites without obtaining consent from the author. Download presentation by click this link. If you encounter any issues during the download, it is possible that the publisher has removed the file from their server.
E N D
Presentation Transcript
Views of Climate and Learning (VOCAL): Dashboard Demo July 26, 2022
Views of Climate and Learning (VOCAL): Context & New Data Reports 01 CONTENTS 02 PowerBi/Edwin VOCAL Dashboard Demo 03 VOCAL Resources
01 Context & New Data Reports
VOCAL in Context: The CASEL* Wheel Views of Climate and Learning (VOCAL) Social and Emotional Indicator System (SELIS) School Classroom Measures students views of their school climate Measures students views of their 5 core SEL competencies Self- Self- Awareness Management DESE sponsored: MCAS o G4/G5: 46 items o G8/G10: 48 items DESE sponsored: F151 Grant Available Social and Emotional Construct Responsible Decision- making Social Awareness Relationship Skills *Collaborative for Academic and Social and Emotional Learning 4
What does VOCAL* tell us? It tells us how students view three dimensions and nine topic areas of school climate: Grades 4, 5, 8, and 10 Engagement Dimension Culture competence (CLC) Participation (PAR) Relationships (REL) School Climate o o o Engagement Safety Environment Environment Dimension Discipline (DIS) Instructional (INS) Mental health (MEN) EMO BUL PSF DIS MEN INS o CLC REL PAR o Item... Item... Item... Item... Item... Item... Item... Item... Item... o Item... Item... Item... Item... Item... Item... Item... Item... Item... Item... Item... Item... Item... Item... Item... Item... Item... Item... Safety Dimension Bullying/cyber-bullying (BUL) Emotional safety (EMO) Physical safety (PSF) Item... Item... Item... Item... Item... Item... Item... Item... Item... Item... Item... Item... Item... Item... Item... Item... Item... Item... o o o 5 *Based on U.S. Dept. of Education s Conceptual Framework
New data reports at the school- and student group- level (2022) Dimension scores (Engagement, Safety, Environment) for student groups (N 20) Participation (Engagement Topic) score at school level (N 50) o In my academic classes, students wrestle with problems that don't have an obvious answer. G8 o In my classes, students teach each other how they solved a problem. G5 Instructional Environment (Environment Topic) score at school level (N 50) o Students are given multiple opportunities to show that they have mastered their classwork. G8 o In my classes, mistakes or even failure on an assignment are viewed as an important part of our learning. G10 Bullying (Safety Topic) score at school level (N 50) o In my school, groups of students tease or pick on one student. G4, G5, G8, G10 o Teachers, students, and the principal work together to prevent (stop) bullying. G4, G5, G8, G10 6
New data visualization (+associated narratives): Index/scaled score distribution divided using 3 cut-points Percent of students within each school climate category (District) Percent of students within each school climate category (School) Percent of Students Percent of Students 100 100 80 80 60 60 42% 34% 34% 32% 40 40 28% 12% 11% 20 20 6% 0 0 Least favorable (<=30) Somewhat favorable (31 - 50) Favorable (51 - 70) Most favorable (>70) Least favorable (<=30) Somewhat favorable (31 - 50) Favorable (51 - 70) Most favorable (>70) Overall VOCAL score used to categorize student views into four scoring groups 3 cut points benchmark and describe student views (30, 50, and 70) Reported out at state-, district-, school-, and grade-level for comparative analyses 7
VOCAL reporting details: Report timeline (2023 going forward) Preliminary report: Late June/early July o Final report: Late September/early October o New reporting format Edwin (Security Portal) Power BI interface graphics, visuals (2018 through 2022 ...) Downloads available using paginated reports for data analyses o o o 8
02 PowerBi/Edwin VOCAL Dashboard Demo
03 VOCAL Resources
Resources and VOCAL webinar Resources: (note: 2022 state report will be posted in September) Foreign language translations Brazilian Portuguese, Haitian Creole, Simplified Chinese, Spanish User guides (2022, 2021, 2019) Grade-level School Climate Profiles (2022, 2021, 2019, 2018) State Reports (2022, 2021, 2019, 2018) Interpretive guide and Action Plan template (2022, 2019, 2018) VOCAL Item Crosswalk (CASEL SEL, PBIS, Accessible Instruction) o Webinars: Invite will be emailed and posted in Commissioner s Update September VOCAL Dashboard Webinar for districts/schools (TBD) September VOCAL data analyses Webinars (Sept. 14; Sept. 29) 11
Thank you! Shelagh Peoples, Psychometric Coordinator Shelagh.Peoples@mass.gov research@doe.mass.edu 781-338-3119

:")


:")