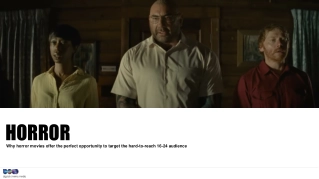
Going to the movies

Going to the movies
Making decisions
Going to the movies – Frequency tables
How is this different
to other frequency
tables you’ve seen?
What does
this symbol
mean?
What might
these 3
numbers be?
Going to the movies – Exercise
Di
splay the movie rankings as a frequency table using class intervals
.
Frequency histograms – Features
The y-axis
represents the
frequency
A ½ column
width is left
between the
vertical axis and
first column
The columns are
next to one
another with no
gaps
The x-axis
represents
the scores
4
Frequency histograms –
What are they?
A histogram is a graphical representation of a frequency
distribution table.
It is usually used when the data is continuous.
5
Frequency histograms – W
orked example
Create a frequency histogram using the movie run time data in the frequency table.
Frequency table
How are these
intervals
represented on the
graph?
Frequency histogram
What would
happen if the
100-109 bin
was 0?
What would happen
if you went up by 2’s
or 3’s?
6
Frequency histograms – Exercise
Create a frequency histogram using the movie review ratings shown in the frequency table.
Frequency table
Frequency histogram
7
Frequency histograms – The
answer
Frequency table
Frequency histogram
8
Frequency histograms
Comparing frequency histograms to column graphs
9
Frequency polygons - Features
What do you
notice?
Why might the
frequency
polygon start
and end at zero?
How is a
frequency
polygon
different than a
line graph?
Can you write a
definition for a
frequency polygon?
Your turn… Add a
frequency polygon
to each of your
histograms
10
Frequency polygons – Solution
A frequency polygon is a graph that shows the
frequencies of grouped data.
It is made by joining the midpoints of the columns of a
frequency histogram
The polygon starts on the horizontal axis at what would
be the midpoint of the bar before the first bar, and ends
on the horizontal axis at what would be the midpoint of
the bar after the last bar.
11
Success criteria
•
I can draw a histogram
•
I can draw a polygon
•
I can compare histograms with column graphs
•
I can compare polygons to line graphs
Exploring movie-related data through frequency tables and histograms reveals insights into movie rankings, review ratings, and run times. The visualizations help in understanding distribution patterns and making informed decisions based on the data presented.

Download Presentation

Please find below an Image/Link to download the presentation.
The content on the website is provided AS IS for your information and personal use only. It may not be sold, licensed, or shared on other websites without obtaining consent from the author.If you encounter any issues during the download, it is possible that the publisher has removed the file from their server.
You are allowed to download the files provided on this website for personal or commercial use, subject to the condition that they are used lawfully. All files are the property of their respective owners.
The content on the website is provided AS IS for your information and personal use only. It may not be sold, licensed, or shared on other websites without obtaining consent from the author.
E N D
Presentation Transcript
Going to the movies Making decisions
Going to the movies Frequency tables How is this different to other frequency tables you ve seen? Class interval Frequency 155-<160 3 160-<165 2 What does this symbol mean? What might these 3 numbers be? 165-<170 9 170-<175 7 175-<180 10 180-<185 5
Going to the movies Exercise Display the movie rankings as a frequency table using class intervals. Review Rating Frequency 4 < 5 5 < 6 6 < 7 7 < 8 8 < 9 2 2 9 17 4
Frequency histograms Features The columns are next to one another with no gaps The y-axis represents the frequency A column width is left between the vertical axis and first column The x-axis represents the scores 4
Frequency histograms What are they? A histogram is a graphical representation of a frequency distribution table. It is usually used when the data is continuous. 5
Frequency histograms Worked example Create a frequency histogram using the movie run time data in the frequency table. Frequency histogram Frequency table What would happen if the 100-109 bin was 0? Movie run time Frequency 90-99 4 Frequency 100-109 1 110-119 6 120-129 5 130-139 11 140-149 6 Movie run times (in minutes) How are these intervals represented on the graph? What would happen if you went up by 2 s or 3 s? 6
Frequency histograms Exercise Create a frequency histogram using the movie review ratings shown in the frequency table. Frequency table Frequency histogram Ratings Frequency 4-4.9 2 5-5.9 2 6-6.9 9 7-7.9 17 8-8.9 4 7
Frequency histograms The answer Frequency table Frequency histogram Ratings Frequency Frequency 4-4.9 2 5-5.9 2 6-6.9 9 7-7.9 17 8-8.9 4 Movie ratings 8
Frequency histograms Comparing frequency histograms to column graphs Frequency histogram Column Graph Columns together yes / no yes / no Gap left at start yes / no yes / no Can be drawn on its side yes / no yes / no Data type used categorical / numerical categorical / numerical 9
Frequency polygons - Features Can you write a definition for a frequency polygon? What do you notice? Why might the frequency polygon start and end at zero? Frequency How is a frequency polygon different than a line graph? Your turn Add a frequency polygon to each of your histograms Movie run time 10
Frequency polygons Solution A frequency polygon is a graph that shows the frequencies of grouped data. It is made by joining the midpoints of the columns of a frequency histogram Frequency The polygon starts on the horizontal axis at what would be the midpoint of the bar before the first bar, and ends on the horizontal axis at what would be the midpoint of the bar after the last bar. Movie ratings 11
Success criteria I can draw a histogram I can draw a polygon I can compare histograms with column graphs I can compare polygons to line graphs