Counseling Data Dashboard
This dashboard showcases data for counseling services at Chabot College, outlining student contact rates, SEP completion percentages, and data disaggregation by pathway and program. The workgroup approach focuses on productivity, planning, and meeting student demand effectively.
Download Presentation

Please find below an Image/Link to download the presentation.
The content on the website is provided AS IS for your information and personal use only. It may not be sold, licensed, or shared on other websites without obtaining consent from the author. Download presentation by click this link. If you encounter any issues during the download, it is possible that the publisher has removed the file from their server.
E N D
Presentation Transcript
Counseling Data Dashboard Sadie Ashraf, Joel Gagnon & Patricia Molina Student Services Deans
22-23 Dashboard Workgroup Members Sadie Ashraf Joel Gagnon Dara Greene Michael Lai Christina Lee Purpose Emmanuel Lopez Heather Oshiro Patricia Molina Rafael Valle Consultation W/ Cynthia Gordon da Cruz Rajinder Samra Rachel Ugale Better understand Counseling demand /capacity Inform scheduling i.e data driven scheduling decisions Inform resource requests Inform marketing and outreach decisions
Workgroup Approach Parallel CEMC objectives (i.e. productivity and planning) Track capacity to meet student demand Appointments, drop-ins, SEP completion Utilize existing and reliable data sources Include user training
Metrics Identified Metric #1: Student Contact Rate i.e. Number of students seen / Available counselor hours Example: First week at Chabot College in General Counseling, 300 students were seen with an available 150 Counselor Hours. Student Contact Rate = 2.0 Metric #2: Comprehensive SEP Rate i.e. Percentage of new students w/SEPC Example: Athletic Counseling at Chabot College makes Comprehensive SEPs with 190 of its 240 student athletes by the Oct 15theligibility deadline. Week 9 SEP Rate = 80%
Data Disaggregation By Pathway By Program Time-Frame Reporting (similar to CEMC) Week by Week Term (Summer, Fall, Spring) Year over Year
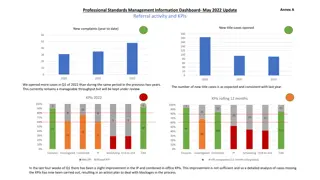
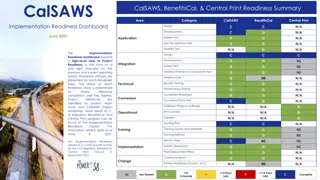
Sample Prototypes Warning Actual Dashboards are still in development The following prototypes contain Made-up data Empty Data Sets Incomplete disaggregation The real dashboard will be even better
Work Remaining Continued Data Clean-up IT Dashboard Development (Ellucian Advise?) Data Automation e.g. Degree Works SEP data reporting Training Additional data exploration (i.e. V2.0, V3.0, etc.) Abbreviated SEP tracking Unmet need Undecided majors/ ed goals
Thank you! Questions? Comments?
