Understanding DRAM Errors: Implications for System Design
Exploring the nature of DRAM errors, this study delves into the causes, types, and implications for system design. From soft errors caused by cosmic rays to hard errors due to permanent hardware issues, the research examines error protection mechanisms and open questions surrounding DRAM errors. Previous work, data analysis, and system studies shed light on the complexities of DRAM error management.

Download Presentation

Please find below an Image/Link to download the presentation.
The content on the website is provided AS IS for your information and personal use only. It may not be sold, licensed, or shared on other websites without obtaining consent from the author. Download presentation by click this link. If you encounter any issues during the download, it is possible that the publisher has removed the file from their server.
E N D
Presentation Transcript
Cosmic Rays Dont Strike Twice: Understanding the Nature of DRAM Errors and the Implications for System Design Andy A. Hwang, Ioan Stefanovici, Bianca Schroeder Presented at ASPLOS 2012
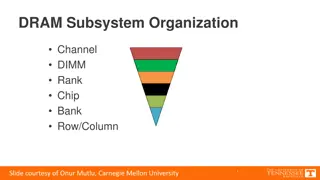
Why DRAM errors? Why DRAM? One of the most frequently replaced components [DSN 06] Getting worse in the future? DRAM errors? A bit is read differently from how it was written 1 0 University of Toronto 2
What do we know about DRAM errors? Soft errors Transient Cosmic rays, alpha particles, random noise Hard errors Permanent hardware problem Error protection None machine crash / data loss Error correcting codes E.g.: SEC-DED, Multi-bit Correct, Chipkill Redundancy E.g.: Bit-sparing University of Toronto 3
What dont we know about DRAM errors? Some open questions What does the error process look like? (Poisson?) What is the frequency of hard vs. soft errors? What do errors look like on-chip? Can we predict errors? What is the impact on the OS? How effective are hardware and software level error protection mechanisms? Can we do better? University of Toronto 4
Previous Work Accelerated laboratory testing Realistic? Most previous work focused specifically on soft errors Current field studies are limited 12 machines with errors [ATC 10] Kernel pages on desktop machines only [EuroSys 11] Error-count-only information from a homogenous population [Sigmetrics 09] University of Toronto 5
The data in our study DIMM DIMM DIMM Memory Controller CPU Error events detected upon [read] access and corrected by the memory controller Data contains error location (node and address), error type (single/multi-bit), timestamp information. University of Toronto 6
The systems in our study DRAM Technology Protection Mechanisms Time (days) DRAM (TB) System Multi-bit Correct, Bit Sparing LLNL BG/L 214 49 DDR Multi-bit Correct, Chipkill, Bit Sparing ANL BG/P 583 80 DDR2 SciNet GPC 211 62 DDR3 SEC-DED DDR[1-2], FBDIMM Google 155 220 Multi-bit Correct Wide range of workloads, DRAM technologies, protection mechanisms. Memory controller physical address mappings In total more than 300 TB-years of data! University of Toronto 7
How common are DRAM errors? Average # Errors per Node / Year Median # Errors per Node / Year Total # of Errors in System Nodes With Errors System 227 x 106 LLNL BG/L 1,724 (5.32%) 3,879 19 1.96 x 10⁹ ANL BG/P 1,455 (3.55%) 844,922 14 49.3 x 10⁶ SciNet GPC 97 (2.51%) 263,268 464 27.27 x 10⁹ Google 20,000 (N/A %) 880,179 303 Errors happen at a significant rate Highly variable number of errors per node University of Toronto 8
How are errors distributed in the systems? Only 2-20% of nodes with errors experience a single error Top 5% of nodes with errors experience > 1 million errors Top 10% of nodes with CEs make up ~90% of all errors After 2 errors, probability of future errors > 90% Distribution of errors is highly skewed Very different from a Poisson distribution Could hard errors be the dominant failure mode? University of Toronto 9
What do errors look like on-chip? Error Mode Repeat address Repeat row Repeat column Whole chip BG/L Banks 80.9% 4.7% 8.8% 0.53% BG/P Banks 59.4% 31.8% 22.7% 3.20% Google Banks 58.7% 7.4% 14.5% 2.02% 1 2 row Single Event 17.6% 29.2% 34.9% column University of Toronto 10
What do errors look like on-chip? Error Mode Repeat address Repeat row Repeat column Whole chip BG/L Banks 80.9% 4.7% 8.8% 0.53% BG/P Banks 59.4% 31.8% 22.7% 3.20% Google Banks 58.7% 7.4% 14.5% 2.02% 1 2 row Single Event 17.6% 29.2% 34.9% column University of Toronto 11
What do errors look like on-chip? Error Mode Repeat address Repeat row Repeat column Whole chip BG/L Banks 80.9% 4.7% 8.8% 0.53% BG/P Banks 59.4% 31.8% 22.7% 3.20% Google Banks 58.7% 7.4% 14.5% 2.02% 1 row 2 Single Event 17.6% 29.2% 34.9% column University of Toronto 12
What do errors look like on-chip? Error Mode Repeat address Repeat row Repeat column Whole chip BG/L Banks 80.9% 4.7% 8.8% 0.53% BG/P Banks 59.4% 31.8% 22.7% 3.20% Google Banks 58.7% 7.4% 14.5% 2.02% 4 1 row 2 5 3 Single Event 17.6% 29.2% 34.9% column University of Toronto 13
What do errors look like on-chip? Error Mode Repeat address Repeat row Repeat column Whole chip BG/L Banks 80.9% 4.7% 8.8% 0.53% BG/P Banks 59.4% 31.8% 22.7% 3.20% Google Banks 58.7% 7.4% 14.5% 2.02% 1 row Single Event 17.6% 29.2% 34.9% column University of Toronto 14
What do errors look like on-chip? Error Mode Repeat address Repeat row Repeat column Whole chip BG/L Banks 80.9% 4.7% 8.8% 0.53% BG/P Banks 59.4% 31.8% 22.7% 3.20% Google Banks 58.7% 7.4% 14.5% 2.02% Single Event 17.6% 29.2% 34.9% The patterns on the majority of banks can be linked to hard errors. University of Toronto 15
What is the time between repeat errors? 2 weeks Repeat errors happen quickly 90% of errors manifest themselves within less than 2 weeks University of Toronto 16
When are errors detected? Error detection Program [read] access Hardware memory scrubber: Google only 1 day Hardware scrubbers may not shorten the time until a repeat error is detected University of Toronto 17
How does memory degrade? 1/3 1/2 of error addresses develop additional errors Top 5-10% develop a large number of repeats 3-4 orders of magnitude increase in probability once an error occurs, and even greater increase after repeat errors. For both columns and rows University of Toronto 18
How do multi-bit errors impact the system? In the absence of sufficiently powerful ECC, multi-bit errors can cause data corruption / machine crash. Can we predict multi-bit errors? > 100-fold increase in MBE probability after repeat errors 50-90% of MBEs had prior warning University of Toronto 19
Are some areas of a bank more likely to fail? Errors are not uniformly distributed Some patterns are consistent across systems Lower rows have higher error probabilities University of Toronto 20
Summary so far Similar error behavior across ~300TB-years of DRAM from different types of systems Strong correlations (in space and time) exist between errors On-chip errors patterns confirm hard errors as dominating failure mode Early errors are highly indicative warning signs for future problems What does this all mean? University of Toronto 21
What do errors look like from the OS p.o.v.? For typical 4Kb pages: Errors are highly localized on a small number of pages ~85% of errors in the system are localized on 10% of pages impacted with errors University of Toronto 22
Can we retire pages containing errors? Page Retirement Move page s contents to different page and mark it as bad to prevent future use Some page retirement mechanisms exist Solaris BadRAM patch for Linux But rarely used in practice No page retirement policy evaluation on realistic error traces University of Toronto 23
What sorts of policies should we use? Physical address space Retirement policies: Repeat-on-address 1-error-on-page 2-errors-on-page Repeat-on-row Repeat-on-column 1 2 University of Toronto 24
What sorts of policies should we use? Physical address space Retirement policies: Repeat-on-address 1-error-on-page 2-errors-on-page Repeat-on-row Repeat-on-column 1 University of Toronto 25
What sorts of policies should we use? Physical address space Retirement policies: Repeat-on-address 1-error-on-page 2-errors-on-page Repeat-on-row Repeat-on-column 1 2 University of Toronto 26
What sorts of policies should we use? Physical address space Retirement policies: Repeat-on-address 1-error-on-page 2-errors-on-page Repeat-on-row Repeat-on-column On-chip 1 1 1 2 2 row 2 column University of Toronto 27
What sorts of policies should we use? Physical address space Retirement policies: Repeat-on-address 1-error-on-page 2-errors-on-page Repeat-on-row Repeat-on-column On-chip 1 1 1 row 2 2 column 2 University of Toronto 28
How effective is page retirement? For typical 4Kb pages: (MBE) 1-error-on-page 1-error-on-page Repeat-on-row Repeat-on-column Repeat-on-row 2-errors-on-page 2-errors-on-page Effective policy Repeat-on-address Repeat-on-address Repeat-on-column 1MB More than 90% of errors can be prevented with < 1MB sacrificed per node Similar for multi-bit errors University of Toronto 29
Implications for future system design OS-level page retirement can be highly effective Different areas on chip are more susceptible to errors than others Selective error protection Potential for error prediction based on early warning signs Memory scrubbers may not be effective in practice Using server idle time to run memory tests (eg: memtest86) Realistic DRAM error process needs to be incorporated into future reliability research Physical-level error traces have been made public on the Usenix Failure Repository University of Toronto 30
Thank you! Please read the paper for more results! Questions ? University of Toronto 31