Understanding Multiple Linear Regression: An In-Depth Exploration
Explore the concept of multiple linear regression, extending the linear model to predict values of variable A given values of variables B and C. Learn about the necessity and advantages of multiple regression, the geometry of best fit when moving from one to two predictors, the full regression equat
4 views • 31 slides
Understanding Multicollinearity in Regression Analysis
Multicollinearity in regression occurs when independent variables have strong correlations, impacting coefficient estimation. Perfect multicollinearity leads to regression model issues, while imperfect multicollinearity affects coefficient estimation. Detection methods and consequences, such as incr
1 views • 11 slides
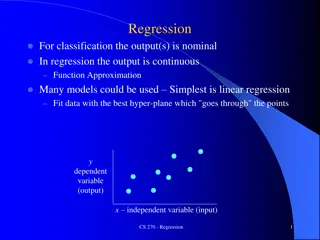
Understanding Regression in Machine Learning
Regression in machine learning involves fitting data with the best hyper-plane to approximate a continuous output, contrasting with classification where the output is nominal. Linear regression is a common technique for this purpose, aiming to minimize the sum of squared residues. The process involv
1 views • 34 slides
Understanding Multiple Regression in Statistics
Introduction to multiple regression, including when to use it, how it extends simple linear regression, and practical applications. Explore the relationships between multiple independent variables and a dependent variable, with examples and motivations for using multiple regression models in data an
0 views • 19 slides
Overview of Linear Regression in Machine Learning
Linear regression is a fundamental concept in machine learning where a line or plane is fitted to a set of points to model the input-output relationship. It discusses fitting linear models, transforming inputs for nonlinear relationships, and parameter estimation via calculus. The simplest linear re
0 views • 14 slides
Understanding Least-Squares Regression Line in Statistics
The concept of the least-squares regression line is crucial in statistics for predicting values based on two-variable data. This regression line minimizes the sum of squared residuals, aiming to make predicted values as close as possible to actual values. By calculating the regression line using tec
0 views • 15 slides
Understanding Variation in Statistical Studies
Variability is key in statistical studies, shaping the essence of statistical analysis. Students often struggle to grasp the concept of variability, despite being taught statistical methods. The term "variation" takes on different meanings in various statistical contexts, presenting challenges in co
2 views • 54 slides
Introduction to Data Collection & Statistics: Understanding Statistical Questions, Population, and Sampling
This material introduces the fundamental concepts of data collection and statistics. Learning objectives include distinguishing statistical questions, identifying populations and samples, and understanding the difference between observational studies and experiments. It discusses the process of stat
1 views • 14 slides
Understanding Regression Analysis: Meaning, Uses, and Applications
Regression analysis is a statistical tool developed by Sir Francis Galton to measure the relationship between variables. It helps predict unknown values based on known values, estimate errors, and determine correlations. Regression lines and equations are essential components of regression analysis,
0 views • 10 slides
Introduction to Binary Logistic Regression: A Comprehensive Guide
Binary logistic regression is a valuable tool for studying relationships between categorical variables, such as disease presence, voting intentions, and Likert-scale responses. Unlike linear regression, binary logistic regression ensures predicted values lie between 0 and 1, making it suitable for m
7 views • 17 slides
Understanding Linear Regression: Concepts and Applications
Linear regression is a statistical method for modeling the relationship between a dependent variable and one or more independent variables. It involves estimating and predicting the expected values of the dependent variable based on the known values of the independent variables. Terminology and nota
0 views • 30 slides
Understanding Regression Analysis: A Statistical Tool for Relationship Measurement
Regression analysis is a statistical technique developed by Sir Francis Galton in 1877 to measure the relationship between variables, one dependent on the other. This analysis helps estimate unknown values of a dependent variable based on known values of an independent variable. It is widely used in
0 views • 10 slides
Understanding Binary Logistic Regression and Its Importance in Research
Binary logistic regression is an essential statistical technique used in research when the dependent variable is dichotomous, such as yes/no outcomes. It overcomes limitations of linear regression, especially when dealing with non-normally distributed variables. Logistic regression is crucial for an
0 views • 20 slides
Exploring the Power of Wise Queries in Statistical Learning
Dive into the world of statistical learning with a focus on the impact of wise queries. Discover how statistical problems are approached, the significance of statistical queries, and the comparisons between wise and unary queries. Explore the implications for PAC learning and uncover key insights in
0 views • 8 slides
Understanding IBM SPSS for Statistical Analysis
IBM SPSS, formerly known as Statistical Package for the Social Sciences, is a powerful software package for statistical analysis used by researchers across various industries. Developed in the late 1960s, SPSS offers features for data management, statistical analysis, and data documentation. It simp
1 views • 13 slides
Understanding Hypotheses, Probability, and Statistical Tests in Social Research
This content delves into formulating hypotheses in social science, selecting statistical tests based on variables' measurement levels, understanding probability in statistical analysis, and distinguishing between null and alternative hypotheses. It emphasizes the research process involving hypothesi
5 views • 21 slides
Arctic Sea Ice Regression Modeling & Rate of Decline
Explore the rate of decline of Arctic sea ice through regression modeling techniques. The presentation covers variables, linear regression, interpretation of scatterplots and residual plots, quadratic regression, and the comparison of models. Discover the decreasing trend in Arctic sea ice extent si
1 views • 9 slides
Understanding Overdispersed Data in SAS for Regression Analysis
Explore the concept of overdispersion in count and binary data, its causes, consequences, and how to account for it in regression analysis using SAS. Learn about Poisson and binomial distributions, along with common techniques like Poisson regression and logistic regression. Gain insights into handl
0 views • 61 slides
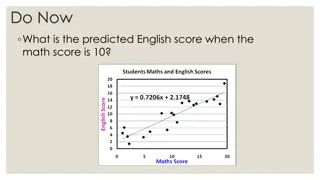
Understanding Regression Lines for Predicting English Scores
Learn how to utilize regression lines to predict English scores based on math scores, recognize the dangers of extrapolation, calculate and interpret residuals, and understand the significance of slope and y-intercept in regression analysis. Explore the process of making predictions using regression
0 views • 34 slides
Understanding Logistic Regression in Multi-level Hierarchies
Explore the intricacies of logistic regression in cross-level hierarchies through helpful project advice, model graphs, and leftover considerations. Learn about transforming binary responses, interpreting log-odds, and conducting multilevel logistic regression with random intercepts. Dive into real-
0 views • 21 slides
Conditional and Reference Class Linear Regression: A Comprehensive Overview
In this comprehensive presentation, the concept of conditional and reference class linear regression is explored in depth, elucidating key aspects such as determining relevant data for inference, solving for k-DNF conditions on Boolean and real attributes, and developing algorithms for conditional l
0 views • 33 slides
Exploring Curve Fitting and Regression Techniques in Neural Data Analysis
Delve into the world of curve fitting and regression analyses applied to neural data, including topics such as simple linear regression, polynomial regression, spline methods, and strategies for balancing fit and smoothness. Learn about variations in fitting models and the challenges of underfitting
0 views • 33 slides
Jumping into Statistics: Study Design & Statistical Analysis in Medical Research
Explore the fundamentals of study design & research methodology, learn to select appropriate statistical tests, and practice statistical analysis using JMP Pro Software. Topics include research question formulation, statistical methods, regression, survival analysis, data visualization, and more. Un
0 views • 31 slides
Understanding Linear Regression and Gradient Descent
Linear regression is about predicting continuous values, while logistic regression deals with discrete predictions. Gradient descent is a widely used optimization technique in machine learning. To predict commute times for new individuals based on data, we can use linear regression assuming a linear
0 views • 30 slides
Understanding Multiclass Logistic Regression in Data Science
Multiclass logistic regression extends standard logistic regression to predict outcomes with more than two categories. It includes ordinal logistic regression for hierarchical categories and multinomial logistic regression for non-ordered categories. By fitting separate models for each category, suc
0 views • 23 slides
Understanding Regression Analysis in Machine Learning
Regression analysis is a statistical method used in machine learning to model the relationship between dependent and independent variables. It helps predict continuous values like temperature, sales, and more. By analyzing examples and terminologies related to regression, one can grasp the concept a
0 views • 39 slides
Enhancing Statistical Capacities of OIC Member Countries to Achieve SDGs: The Role of SESRIC
This presentation discusses the importance of enhancing statistical capacities in OIC member countries to achieve Sustainable Development Goals (SDGs), with a focus on the role of SESRIC. It covers the evolution of statistical definitions, the use of Statistical Capacity Index (SCI) for analysis, an
2 views • 17 slides
Methods for Handling Collinearity in Linear Regression
Linear regression can face issues such as overfitting, poor generalizability, and collinearity when dealing with multiple predictors. Collinearity, where predictors are linearly related, can lead to unstable model estimates. To address this, penalized regression methods like Ridge and Elastic Net ca
0 views • 70 slides
Understanding Regression Analysis in Statistical Research
Regression analysis, specifically focusing on the R2 statistic, is a method used to examine the relationship between two variables at an interval/ratio level. It evaluates how well a line fits the data and measures the strength of the relationship between independent and dependent variables. Being s
0 views • 5 slides
Statistical Analysis: Correlation and Regression Study by Dr. Said T. El Hajjar
In the second semester of 2017 at Ahlia University, Dr. Said T. El Hajjar presented a study focusing on correlation and regression analysis. The study investigated the relationship between independent variables PP and SS with the dependent variable TP. Through various case scenarios, the study revea
0 views • 18 slides
Determining Email Spam using Statistical Analysis and Machine Learning
The discussion revolves around classifying spam from ham emails by analyzing word frequencies. Various techniques such as Logistic Regression, Linear Discriminant Analysis, and 10-fold Cross-Validation are employed to achieve this goal. Statistical analysis and machine learning models like LDA and L
0 views • 8 slides
Understanding Linear Regression Analysis: Testing for Association Between X and Y Variables
The provided images and text explain the process of testing for association between two quantitative variables using Linear Regression Analysis. It covers topics such as estimating slopes for Least Squares Regression lines, understanding residuals, conducting T-Tests for population regression lines,
0 views • 26 slides
Data Analysis and Regression Quiz Overview
This quiz covers topics related to traditional OLS regression problems, generalized regression characteristics, JMP options, penalty methods in Elastic Net, AIC vs. BIC, GINI impurity in decision trees, and more. Test your knowledge and understanding of key concepts in data analysis and regression t
0 views • 14 slides
Understanding Survival Analysis: Hazard Function and Cox Regression
Survival analysis examines hazards, such as the risk of events occurring over time. The Hazard Function and Cox Regression are essential concepts in this field. The Hazard Function assesses the risk of an event in a short time interval, while Cox Regression, named after Sir David Cox, estimates the
0 views • 20 slides
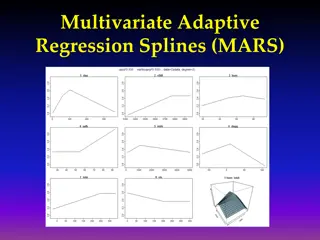
Understanding Multivariate Adaptive Regression Splines (MARS)
Multivariate Adaptive Regression Splines (MARS) is a flexible modeling technique that constructs complex relationships using a set of basis functions chosen from a library. The basis functions are selected through a combination of forward selection and backward elimination processes to build a smoot
0 views • 13 slides
R Short Course Session 5 Overview: Linear and Logistic Regression
In this session, Dr. Daniel Zhao and Dr. Sixia Chen from the Department of Biostatistics and Epidemiology at the College of Public Health, OUHSC, cover topics on linear regression including fitting models, checking results, examining normality, outliers, collinearity, model selection, and comparison
0 views • 44 slides
Understanding Correlation and Regression in Statistical Analysis
Exploring the concepts of correlation, regression, and hypothesis testing in statistical analysis to assess relationships between variables, determine effect sizes, and interpret results. Key topics include z-scores, comparing means, and the general requirements for applying correlation analysis.
0 views • 36 slides
Multivariate Adaptive Regression Splines (MARS) in Machine Learning
Multivariate Adaptive Regression Splines (MARS) offer a flexible approach in machine learning by combining features of linear regression, non-linear regression, and basis expansions. Unlike traditional models, MARS makes no assumptions about the underlying functional relationship, leading to improve
0 views • 42 slides
Introduction to Machine Learning: Model Selection and Error Decomposition
This course covers topics such as model selection, error decomposition, bias-variance tradeoff, and classification using Naive Bayes. Students are required to implement linear regression, Naive Bayes, and logistic regression for homework. Important administrative information about deadlines, mid-ter
0 views • 42 slides
Statistical Tools for Method Validation in USP General Chapter 1210
In the USP General Chapter 1210, Statistical Tools for Method Validation are outlined, serving as a companion to the validation of Compendial Procedures. The chapter covers important topics like Accuracy, Precision, Linearity, LOD, LOQ, and range. It emphasizes statistical tools such as TOST, statis
0 views • 22 slides
