Introduction to Stata
Powerful data analysis software, including data management, visualization, and statistical analysis. Seminar covers navigating Stata, data import, exploring and visualizing data, basic statistical analysis, and outputting to Word and Excel.
5 views • 126 slides
Program Monitoring with Topic Modeling in Stata
Explore how topic modeling using Stata aids in monitoring tablet-based educational interventions in Sub-Saharan Africa. Learn about the program's context, methodology, and results to enhance implementation quality. Popular
2 views • 15 slides
Stata's Capabilities for Efficiency and Productivity Assessment
Stata offers a range of tools for conducting frontier efficiency and productivity assessments, including nonparametric and parametric approaches, technical efficiency modeling, different orientations in DEA, productivity estimation techniques, and popular models like MPI and MLPI. The software empow
4 views • 50 slides
Introduction to Meta-analysis in Stata
This workshop, presented by Dr. Christine R. Wells from UCLA, provides an in-depth exploration of meta-analysis in Stata. Participants will learn about systematic reviews, data collection and organization, running meta-analyses, interpreting results, creating graphs, and identifying biases. The focu
2 views • 181 slides
Quickly locate reproducibility failures in Stata code
Explore DIME Analytics' Stata command for efficiently identifying reproducibility issues in Stata code, crucial in research to meet journal-led requirements and avoid potential setbacks. Learn more about the significance of reproducibility in data analysis projects and the tools provided by DIME Ana
0 views • 30 slides
Introduction to Difference in Differences Using Stata
Learn about Difference in Differences analysis using Stata with Chuck Huber at the Indian Stata Conference. The presentation covers the conceptual introduction, parallel trends assumption, and more using practical examples and panel data. Download slides and resources for further exploration.
3 views • 93 slides
Understanding Q-Methodology: A Stata Analysis Overview
Q-Methodology is a research approach focusing on subjective viewpoints. This article discusses the history, goals, and steps involved in a Q-methodology study using Stata programs. It covers the development of a concourse, creation of a Q-sample, Q-sorting activities, and analysis and interpretation
5 views • 46 slides
Data Management Workshop: Stata Commands for Statistical Analysis
This workshop conducted by UCLA's OARC covers essential Stata commands for preparing data sets for statistical analysis. It includes topics like inspecting and creating variables, handling missing data, merging datasets, and processing data efficiently. Participants will learn to use do-files, write
2 views • 79 slides
Exporting STATA Results to Excel Using PutExcel Feature
Learn how to utilize the PutExcel feature in STATA to effortlessly export your results to an Excel file. With PutExcel, you can export matrices, stored results, images, estimation tables, and even add formulas for calculations. This tool streamlines the process of transferring statistical data to Ex
3 views • 32 slides
Understanding Three-Way Interactions in Regression Models
Three-way interactions in regression models add complexity to interpreting the effects of predictors. This article explains how to decompose three-way interactions in Stata, model them effectively, and assess their significance using contrast tests. Practical examples and Stata commands are provided
0 views • 17 slides
Understanding Adjusted Predictions and Marginal Effects in Stata
This presentation by Richard Williams from the University of Notre Dame discusses the importance of adjusted predictions and marginal effects in interpreting results. It explains factor variables, different approaches to adjusted predictions, and uses NHANES II data to demonstrate concepts. The talk
1 views • 49 slides
Unified Stata Package for Sample Size Calculations in Clinical Trials
A comprehensive overview of artbin, a Stata package for determining sample sizes in trials with binary outcomes. This tool is essential for designing effective clinical trials across various disciplines and has recently undergone significant enhancements. Unlike other software, artbin offers a wide
1 views • 23 slides
Understanding Economic Forecasting with Simulation Models
Explore the concept of economic forecasting using multi-equation simulation models, focusing on producing data that follows estimated equations rather than estimating model parameters. Learn about endogenous and exogenous variables, the importance of assumptions in forecasting, and the use of simula
0 views • 38 slides
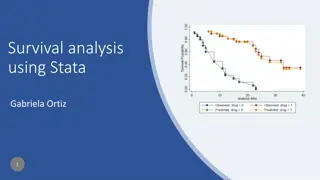
Survival Analysis Using Stata - Overview and Data Examination
This content discusses survival analysis using Stata, covering topics such as survival-time data, exploratory graphs, estimation, models, predictions, diagnostics, testing assumptions, and more. It explains how survival-time data is measured and discusses various examples and scenarios related to su
0 views • 83 slides
Creating PowerPoint Presentations in Stata with Slide Deck
Discover how to generate PowerPoint presentations directly from Stata using Slide Deck, a suite of programs leveraging Python integration. Learn about the prerequisites, how it works, and key terminology. Follow a sample session to load economic data and save graphs for effective presentation.
1 views • 16 slides
Advances in Sample Size Calculations for Clinical Trials: The ART Suite
This presentation discusses the importance of sample size calculations in research studies, especially in the context of clinical trials. It covers tools like ART and Power in Stata for binary and categorical outcomes, emphasizing the need to determine the right sample size to ensure research questi
3 views • 35 slides
Comprehensive Overview of Admetan: A New Meta-Analysis Command
This meta-analysis command, Admetan, introduced by David Fisher from MRC Clinical Trials Unit at UCL, offers a comprehensive analysis of combining results from independent studies. It builds on the history of meta-analysis in Stata and aims to enhance capabilities for researchers. Admetan provides f
1 views • 19 slides
Understanding Economic Polarization and Polarization Indices
Explanation of the concept of economic polarization and the calculation of polarization indices for population subgroups using Stata. Discusses the disappearance of the middle income class, misuse of the term economic polarization, and measures like the median relative polarization index (MRP) for a
2 views • 15 slides
Panel Stochastic Frontier Models with Endogeneity in Stata
Introducing xtsfkk, a new Stata command for fitting panel stochastic frontier models with endogeneity, offering better control for endogenous variables in the frontier and/or the inefficiency term in longitudinal settings compared to standard estimators. Learn about the significance of stochastic fr
0 views • 13 slides
Analyzing Data Complexity in the Survey of Income and Program Participation (SIPP)
The presentation delves into critical issues in data analysis using the SIPP, emphasizing the importance of setting up a structured analysis plan in STATA. Key considerations include determining the unit of analysis, whether at an individual or household level, and how to identify sampling units usi
5 views • 22 slides
Coding Simulation Studies in Stata: A Practical Approach
Understanding simulation studies and their importance in evaluating statistical methods, this presentation delves into the precise coding techniques required in Stata to generate simulated datasets, produce estimates, and analyze performance metrics. With a focus on consistent terminology, data-gene
5 views • 18 slides
Doing Less with Stata Markdown
Explore how Stata Markdown simplifies the process of combining analysis and write-up, making it easy to read and write. Learn about the integration of Markdown with dynamic Stata code to automate document assembly, providing a seamless workflow for researchers and analysts.
0 views • 18 slides
Strategies for Effective Data Visualization
This talk by Nicholas J. Cox explores strategies to enhance data visualization for better interpretation and comparison. From spaghetti plots to front-and-back plots, various techniques are discussed to improve the clarity and effectiveness of graphical presentations. The presentation emphasizes the
1 views • 47 slides
On the Shoulders of Giants: Harnessing Powerful Commands in Stata for Efficient Coding
Stata users can enhance their coding efficiency by utilizing powerful commands that are often overlooked. This presentation showcases examples of commands that can streamline coding work, ranging from interactive use to supporting long programs. By leveraging these commands, users can avoid reinvent
0 views • 51 slides
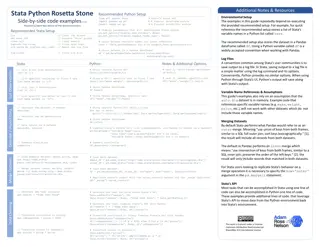
Stata-Python Rosetta Stone: Side-by-side Code Examples v1.0
A comprehensive guide providing side-by-side code examples in Stata, Python, and R, facilitating easy translation between the languages. It covers setting up Python for Stata, handling dataframes, storing datasets, working with log files, merging datasets, describing and summarizing data, and more.
1 views • 21 slides
Introduction to Stata Programming Basics
Explore the fundamentals of Stata programming, including navigating the Stata system, manipulating data, creating variables, and working with the Stata screen. Learn essential syntax rules, setting up the Do file, and accessing and managing data in Stata.
0 views • 30 slides
Accessing and Utilizing CPCSSN Secure Research Environment (SRE)
Learn how to access the CPCSSN Secure Research Environment (SRE) for secure data analysis. Follow steps such as setting up VPN, accessing SQL databases, and establishing ODBC connections for statistical analysis using tools like SAS, R, SPSS, or Stata. Enhance your research capabilities within a sec
0 views • 12 slides
The Power of Quantile Plots in Data Analysis
Quantile plots are a powerful tool for visualizing ordered values against rank or cumulative probability. They have a rich history and are considered essential for showcasing univariate distributions effectively. Learn about their origins, usage in Stata, and related plot types in this insightful ex
0 views • 60 slides
Understanding Contamination in Research Studies
Understand the concept of contamination in research studies, its impact on the effectiveness of Randomized Controlled Trials (RCTs), and different analysis methods to handle contamination, such as Intention-to-Treat (ITT) and Contamination-Adjusted Intention-to-Treat (CA-ITT) analyses. Learn how to
0 views • 40 slides
Utilizing Replicate Estimate (Repest) for PISA and PIAAC Data Analysis in Stata
Explore how to use the Stata routine Repest for complex survey designs, accommodating final weights, replicate weights, and imputed variables in PISA and PIAAC data analysis. Learn to install and apply Repest to compute means of variables while accounting for sampling variance, clustering, and strat
0 views • 28 slides
Enhancing Stata Learning with Prompt-Based Programming
Explore the benefits of prompt-based programming in easing the learning curve of Stata software. This innovative approach simplifies syntax, reduces errors, and enhances efficiency for data analysis tasks. By comparing prompt-based versus traditional syntax methods, researchers can improve their ski
1 views • 54 slides
Unveiling the Power of Quantile Plots for Data Visualization
Explore the significant role of quantile plots in displaying ordered values against ranks or probabilities. Delve into their historical significance, usage in Stata, and related plot variations for effective data analysis. Gain insights into why quantile plots remain a preferred choice for visualizi
0 views • 62 slides
Semaglutide Audit: HbA1c and Weight Changes at 6- and 12-Months Post Commencement
Updated results from the ABCD Semaglutide audit show significant weight reductions at 6 months in GLP1RA-naive individuals, with no significant change at 12 months. Similarly, HbA1c reductions were greater at 6 months for GLP1RA-naive individuals compared to switch individuals, showing significant i
0 views • 9 slides
Analysis of Complex Sample Data Short Course - Qatar University 2016
Conducted at Qatar University in 2016, this short course on the Analysis of Complex Sample Data provided participants with in-depth knowledge on survey data analysis using software like Stata and other alternatives like SPSS, SAS, R, Mplus, etc. Led by experts from the University of Michigan, the co
0 views • 74 slides
The Right Way to Code Simulation Studies in Stata
Simulation studies in Stata involve using (pseudo) random numbers to generate data from a distribution for studying statistical methods. This process helps to evaluate different scenarios and understand the properties of statistical techniques. Key components like ADEMP (Aims, Data-generating mechan
1 views • 18 slides
Crafting Graph Schemes in Stata by Tim Morris at UCL
Explore the art of crafting graph schemes in Stata presented by Tim Morris from the MRC Clinical Trials Unit at UCL. The content showcases the beauty of breaking rules in typography with insightful quotes and visual examples.
0 views • 21 slides

