Introduction to Stata
Powerful data analysis software, including data management, visualization, and statistical analysis. Seminar covers navigating Stata, data import, exploring and visualizing data, basic statistical analysis, and outputting to Word and Excel.

Download Presentation

Please find below an Image/Link to download the presentation.
The content on the website is provided AS IS for your information and personal use only. It may not be sold, licensed, or shared on other websites without obtaining consent from the author.If you encounter any issues during the download, it is possible that the publisher has removed the file from their server.
You are allowed to download the files provided on this website for personal or commercial use, subject to the condition that they are used lawfully. All files are the property of their respective owners.
The content on the website is provided AS IS for your information and personal use only. It may not be sold, licensed, or shared on other websites without obtaining consent from the author.
E N D
Presentation Transcript
INTRODUCTION TO STATA UCLA OARC STATISTICAL METHODS AND DATA ANALYTICS
Purpose of the seminar This seminar introduces the usage of Stata for data analysis Topics include Stata as a data analysis software package Navigating Stata Data import Exploring data Data visualization Data management Basic statistical analysis Outputting to Word and Excel
What is Stata? Stata is an easy to use but powerful data analysis software package that features strong capabilities for: Statistical analysis Data management and manipulation Data visualization Stata offers a wide array of statistical tools that include both standard methods and newer, advanced methods, as new releases of Stata are distributed annually
Why use Stata? Command syntax is very compact, saving time Syntax is consistent across commands, so easier to learn Competitive with other software regarding variety of statistical tools Excellent documentation Exceptionally strong support for Econometric models and methods Complex survey data analysis tools
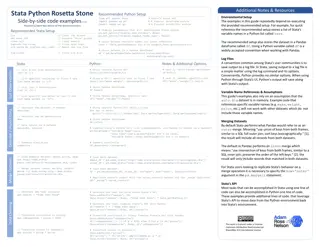
Versions of Stata * Flavors of Stata are BE SE and MP The main difference is the size of dataset allowed and speed of processing - BE SE MP For more information click here https://www.stata.com/products/which-stata- is-right-for-me/ See our webpage for more information about using Stata at UCLA
Navigating Statas interface cd change working directory
Command window You can enter commands directly into the Command window This command will load a Stata dataset over the internet Go ahead and enter the command
Variables window Once data are loaded, variables and their labels appear in the Variable window Clicking on a variable name will cause its description to appear in the Properties Window Double-clicking a variable name will cause it to appear in the Command Window
Properties window The Variables section lists information about selected variable The Data section lists information about the entire dataset
History window The History window lists previously issued commands Successful commands will appear black Unsuccessful commands will appear red Double-click a command to run it again Hitting PageUp will also recall previously used commands
Working directory At the bottom left of the Stata window is the address of the working directory Stata will load from and save files to here, unless another directory is specified Use the command cd to change the working directory
Stata menus Almost all Stata users use syntax to run commands rather than point-and-click menus Nevertheless, Stata provides menus to run most of its data management, graphical, and statistical commands Example: two ways to create a histogram
Do-files doedit open do-file editor
Do-files are scripts of commands Stata do-files are text files where users can store and run their commands Reproducibility: better than retyping commands in Command window Easier debugging and changing commands We recommend always using a do-file when using Stata The file extension .do is used for do-files
Opening the do-file editor Use the command doedit to open the do-file editor Or click on the pencil and paper icon on the toolbar
Syntax highlighting * The do-file editor colors Stata commands blue Comments, which are not executed, are usually preceded by * and are colored green Words in quotes (file names, string values) are colored red As of Stata 16, tab can be used to auto- complete Stata commands and previously typed words
Running commands from the do- file To run a command from the do-file: 1. Highlight part or all of the command, 2. Hit Ctrl-D (Mac: Shift+Cmd+D) or click the Execute(do) icon, the rightmost icon on the do-file editor toolbar Multiple commands can be selected and executed
Comments Comments are not executed, so provide a way to document the do-file Comments are either preceded by * or surrounded by /* and */ Comments will appear in green in the do-file editor
Long lines in do-files * As of Stata 16 long commands automatically wrap In older versions, to extend commands over multiple lines use /// at the end of each line except for the last Make sure to put a space before /// When executing, highlight each line in the command(s)
use load Stata dataset save save Stata dataset clear clear dataset from memory Importing data import excel import Excel dataset import delimited import delimited data (csv)
Stata .dta files Data files stored in Stata s format use the extension .dta Remember that coding files are do-files and usually have a .do extension Double clicking on a .dta file in Windows will open up a the data in a new instance of Stata (not in the current instance) Be careful of having many Statas open
Loading and saving .dta files use loads Stata .dta files .dta files can be loaded from a hard drive or over the internet (using a web address) save stores data in Stata s .dta format The replace overwrites an existing file with the same name (without replace, Stata won t save if the file exists) * read from hard drive; do not execute use "C:/path/to/myfile.dta * load data over internet use https://stats.idre.ucla.edu/stat/data/hs0 * save data, replace if it exists save hs0, replace The extension .dta can be omitted when using use and save
Clearing memory By default Stata will only hold one data set in memory at a time. If the data are altered it in any, we must clear these data from memory before loading in new data. All data import commands have a clear option that clears memory before loading the new dataset. * clear data from memory clear * load data but clear memory first Use https://stats.idre.ucla.edu/stat/data/hs0, clear
Frames * As of Stata 16, multiple datasets can be loaded simultaneously with the frame suite of commands. frame create newframename creates a location in memory called newframename to store a dataset. frame newframename: command can then be used to perform command on the data stored in newframename. frame dir lists the current data frames. Commands not preceded by frame newframename: will be performed on the data in the default frame. * create data frame called data2 frame create data2 * load nhanes2 data into data2 frame frame data2: webuse nhanes2 * describe height and weight in nhanes2 data frame data2: describe height weight * look at data frames frame dir
Importing Excel data sets * Stata can read in data sets stored in many other formats The command import excel is used to import Excel data An Excel filename is required (with path, if not located in working directory) after the keyword using Use the sheet() option to open a particular sheet Use the firstrow option if variable names are on the first row of the Excel sheet * import excel file; change path below before executing import excel using "C:\path\myfile.xlsx", sheet( mysheet") firstrow clear
Importing .csv data sets * Comma-separated values (.csv) files are also commonly used to store data Use import delimited to read in .csv files (and files delimited by other characters such as tab or space) Syntax and options are very similar to import excel But no need for firstrow option (first row is assumed to be variable names in .csv files) * import csv file; change path below before executing import delimited using "C:\path\myfile.csv", clear
Using the menu to import EXCEL and .csv data Because path names can be very long and many options are often needed, menus are often used to import data Select File -> Import and then either Excel spreadsheet or Text data(delimited,*.csv, )
Preparing data for import To get data into Stata cleanly, make sure the data in your Excel file or .csv file have the following properties Rectangular - Each column (variable) should have the same number of rows (observations) - No graphs, sums, or averages in the file Missing data should be left as blank fields - Missing data codes like -999 are ok too (see command mvdecode) Variable names should contain only alphanumeric characters or _ or . Make as many variables numeric as possible - Many Stata commands will only accept numeric variables
Help files and Stata syntax help command open help page for command
Help files Precede a command name (and certain topic names) with help to access its help file. Let s take a look at the help file for the summarize command. *open help file for command summarize help summarize
Help file: title section command name and a brief description link to a .pdf of the Stata manual entry for summarize manual entries include details about methods and formulas used for estimation commands, and thoroughly explained examples.
Help file: syntax section various uses of command and how to specify them bolded words are required the underlined part of the command name is the minimal abbreviation of the command required for Stata to understand it We can use su for summarize italicized words are to be substituted by the user e.g. varlist is a list of one or more variables [Bracketed] words are optional (don t type the brackets) a comma , is almost always used to initiate the list of options
Help file: options section Under the syntax section, we find the list of options and their description Most Stata commands come with a variety of options that alter how they process the data or how they output Options will typically follow a comma Options can also be abbreviated
Help file: syntax section Summary statistics for all variables summarize Summary statistics for just variables read and write (using abbreviated command) summ read write Provide additional statistics for variable read summ read, detail
Help file : the rest Below options are Examples of using the command, including video examples! (occasionally) Click on Also see to open help files of related commands
GETTING TO KNOW YOUR DATA
browse open spreadsheet of data Viewing data list print data to Stata console
Seminar dataset We will use a dataset consisting of 200 observations (rows) and 13 variables (columns) Each observation is a student Variables Demographics gender(1=male, 2=female), race, ses(low, middle, high), etc Academic test scores read, write, math, science, socst Go ahead and load the dataset! * seminar dataset use https://stats.idre.ucla.edu/stat/data/hs0, clear
Browsing the dataset Once the data are loaded, we can view the dataset as a spreadsheet using the command browse The magnifying glass with spreadsheet icon also browses the dataset Black columns are numeric, red columns are strings, and blue columns are numeric with string labels
Listing observations * * list read and write for first 5 observations li read write in 1/5 The list command prints observation to the Stata console Simply issuing list will list all observations and variables Not usually recommended except for small datasets Specify variable names to list only those variables We will soon see how to restrict to certain observations +--------------+ | read write | |--------------| 1. | 57 52 | 2. | 68 59 | 3. | 44 33 | 4. | 63 44 | 5. | 47 52 | +--------------+
in select by observation number Selecting observations if select by condition
Selecting by observation number with in * Many commands are run on a subset of the data set observations in selects by observation (row) number Syntax in firstobs/lastobs 30/100 observations 30 through 100 Negative numbers count from the end L means last observation -10/L tenth observation from the last through last observation * list science for last 3 observations li science in -3/L +---------+ | science | |---------| 198. | 55 | 199. | 58 | 200. | 53 | +---------+
Selecting by condition with if * list gender, ses, and math if math > 70 with clean output li gender ses math if math > 70, clean if selects observations that meet a certain condition gender == 1 (male) math > 50 gender ses 13. 1 high 71 22. 1 middle 75 37. 1 middle 75 55. 1 middle 73 73. 1 middle 71 83. 1 middle 71 97. 2 middle 72 98. 2 high 71 132. 2 low 72 164. 2 low 72 math if clause usually placed after the command specification, but before the comma that precedes the list of options
Stata logical and relational operators == equal to - double equals used to check for equality <, >, <=, >= greater than, greater than or equal to, less than, less than or equal to ! Not != not equal & and | or * browse gender, ses, and read * for females (gender=2) who have read > 70 browse gender ses read if gender == 2 & read > 70
Exercise 1 Load the hs0 dataset using the code: use https://stats.idre.ucla.edu/stat/data/hs0, clear Use the browse command to examine the ses values for students with write score greater than 65 Then, use the help file for the browse command to rewrite the command to examine the ses values without labels. Answers to exercises are at the bottom of the seminar do-file
codebook inspect variable values Exploring data summarize summarize distribution tabulate tabulate frequencies
Explore your data before analysis Take the time to explore your data set before embarking on analysis Get to know your sample with quick summaries of variables Demographics of subjects Distributions of key variables Look for possible errors in variables
Use codebook to inspect variable values For more detailed information about the values of each variable, use codebook, which provides the following: For all variables number of unique and missing values For numeric variables range, quantiles, means and standard deviation for continuous variables frequencies for discrete variables For string variables frequencies warnings about leading and trailing blanks * inspect values of variables read gender and prgtype codebook read gender prgtype ----------------------------------------------------------------------------------------------------- read reading score ----------------------------------------------------------------------------------------------------- type: numeric (float) range: [28,76] units: 1 unique values: 30 missing .: 0/200 mean: 52.23 std. dev: 10.2529 percentiles: 10% 25% 50% 75% 90% 39 44 50 60 67 ----------------------------------------------------------------------------------------------------- gender (unlabeled) ----------------------------------------------------------------------------------------------------- type: numeric (float) range: [1,2] units: 1 unique values: 2 missing .: 0/200 tabulation: Freq. Value 91 1 109 2
Summarizing continuous variables Thesummarizecommand calculates a variable s: number of non-missing observations * summarize continuous variables summarize read math Variable | Obs Mean Std. Dev. Min Max -------------+--------------------------------------------------------- read | 200 52.23 10.25294 28 76 math | 200 52.645 9.368448 33 75 mean standard deviation min and max * summarize read and math for females summarize read math if gender == 2 Variable | Obs Mean Std. Dev. Min Max -------------+--------------------------------------------------------- read | 109 51.73394 10.05783 28 76 math | 109 52.3945 9.151015 33 72