What is Dash?. By Kyle Hinkle and Zachary Stray
Dash, created by Plotly, provides a simple way to build web-based analytical applications without the need for advanced web development knowledge. It leverages Python skills and a combination of Flask, React.js, and Plotly.js to streamline the process of creating interactive data visualizations in r
5 views • 40 slides

Strategic Digital Initiative Presentation for ECONUM Project
This presentation outlines the strategy and responsible approach for the digital transformation of the ECONUM project. It includes details on the project's objectives, mandatory requirements for project submission, contact information for organizing submission meetings, and key considerations for pr
13 views • 15 slides

Going to the movies
Exploring movie-related data through frequency tables and histograms reveals insights into movie rankings, review ratings, and run times. The visualizations help in understanding distribution patterns and making informed decisions based on the data presented.
0 views • 12 slides
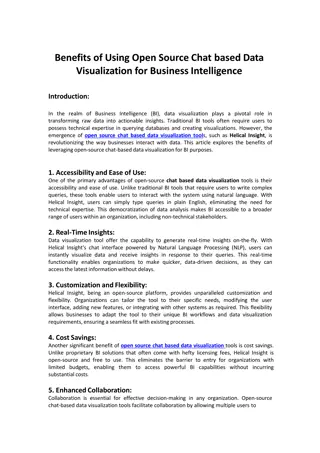
Benefits of Open Source Chat-based Data Visualization
In the realm of Business Intelligence (BI), data visualization plays a pivotal role in transforming raw data into actionable insights. Traditional BI tools often require users to possess technical expertise in querying databases and creating visualizations. However, the emergence of open source chat
1 views • 2 slides
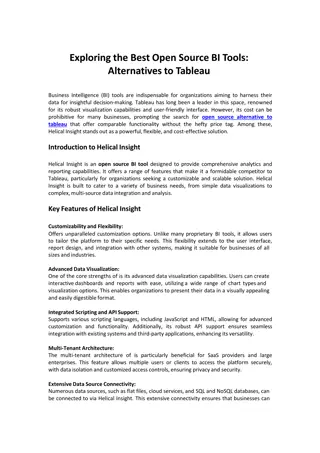
Best Open Source BI Tool Alternatives to Tableau
Helical Insight is an open source BI tool designed to provide comprehensive analytics and reporting capabilities. It offers a range of features that make it a formidable competitor to Tableau, particularly for organizations seeking a customizable and scalable solution. Helical Insight is built to ca
0 views • 2 slides
Bivariate Normal Data Analysis: LPGA 2008 Season Overview
Explore the analysis of bivariate normal data focusing on LPGA driving distance and fairway percent from the 2008 season. Learn how to compute confidence ellipses, estimated means, variance-covariance matrix, eigenvalues, eigenvectors, and plot insightful visualizations. Understand the method, set u
1 views • 8 slides
Leveraging Blackboard Analytics and Tableau for Data Visualization
Create insightful visualizations on student admissions using Blackboard Analytics and Tableau, accessing real-time data and examining OLAP sources. Learn how to efficiently manage and view data for identifying trends in enrollment strategies. Gain a deeper understanding of data-driven decision manag
0 views • 24 slides
Easy Data Analysis & Business Intelligence with Excel Power Tools
Dive into the world of data analysis and business intelligence with Excel Power Tools. Learn how to convert data into actionable insights, create reports and visualizations, and enhance decision-making processes. Instructor Mike Girvin from Highline College guides you through the fundamentals, provi
0 views • 17 slides
Nottingham's Number Fluency Project - Ten-Frame Visualisation for Additive Facts
Explore the Nottinghams Number Fluency Project's innovative method of teaching additive facts using ten-frame visualizations. From basic additions like 1 + 1 = 2 to more complex sums, this project provides engaging visual aids to enhance number fluency and mathematical understanding.
0 views • 92 slides
Microsoft Power BI - Visual Representation of Data Insights
Microsoft Power BI is a powerful business analytics tool that provides interactive visualizations and business intelligence capabilities. It allows users to easily connect to data sources, create interactive reports and dashboards, and share insights across the organization. With features like drag-
0 views • 6 slides

VELCO Vegetation Management Plan Overview 2021
Detailed analysis of the proposed vegetation management plan by VELCO for 2021, including comparisons between planned and actual units, herbicide usage by chemical and line, Rodeo usage by year, scheduled maintenance areas, and ultra-low volume foliar treatments. The data visualizations provide insi
0 views • 12 slides

Multiplying by 3 Numbers Lesson: Associative Property and Problem-Solving
Explore the concept of multiplying three numbers and utilizing the Associative Property of Multiplication. Understand how changing the grouping of factors doesn't affect the product. Engage in problem-solving scenarios involving multiple multiplication operations. Enhance your skills through real-wo
1 views • 20 slides

Analyzing Shot Location Trends in the NBA
Examining shot location trends in the NBA since 1996, this study delves into the impact on offensive strategies. Utilizing shot charts data and visualizations, the analysis uncovers shifts in shooting patterns, correlations, and evolving efficiency. Techniques like K-Means Clustering are employed to
0 views • 12 slides
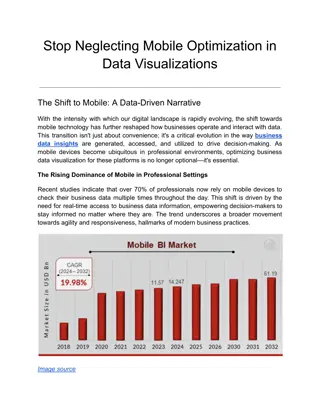
Stop Neglecting Mobile Optimization in Data Visualizations
Explore why mobile optimization is critical for your data visualizations in our latest blog. We delve into the transformative benefits of making your business data insights accessible and intuitive on mobile devices, enhancing decision-making and user engagement. Discover actionable strategies to br
0 views • 8 slides

Global Cotton Outlook 2022/23: Consumption Recovery, Production Growth, and Price Trends
The USDA's Interagency Commodity Estimates Committee presented the global cotton outlook for 2022/23, highlighting a continued consumption recovery, a rise in production to the highest level in 11 years, and a dip in global stocks leading to price retreats. The report discusses the factors influenci
0 views • 36 slides
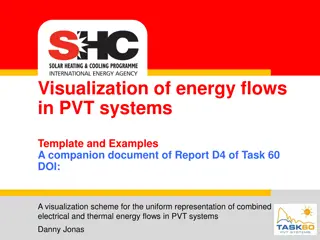
Visualization of Energy Flows in PVT Systems: Examples and Templates
Visualization of energy flows in PVT systems is crucial for understanding the combined electrical and thermal energy processes. This companion document showcases various examples and templates for representing waste heat, energy sources, storage solutions, and system concepts using clear visualizati
1 views • 17 slides
Information Visualization Project Requirements and Guidelines
This document outlines the requirements for individual and group projects in the elective course on Software and Services, focusing on Information Visualization. It includes guidelines for dataset selection, interactive visualizations creation, project submission details, and available datasets for
0 views • 9 slides

Design and Evaluation in Visualization Techniques
Understanding the importance of formal evaluations in visualization techniques, this material covers a range of evaluation methods including empirical and analytic approaches such as usability tests, controlled experiments, and expert reviews. It delves into the scientific method of hypothesis forma
1 views • 41 slides

In-depth Overview of Analytics Plus Software
Analytics Plus is a self-service Business Intelligence and advanced analytics software designed for analyzing IT data with powerful visualizations. It provides key insights to facilitate business-critical decisions. Users can import data from various sources, integrate with ServiceDesk Plus, OpManag
0 views • 14 slides

Prison to Employment Strategy in Southern Border Region
This presentation focuses on the prison to employment strategy for the Southern Border Region, highlighting statistics on incarceration rates in California, specifically San Diego and Imperial Counties. It addresses recidivism rates, supervised populations, and measures of recidivism for state priso
2 views • 7 slides

Realtime Feedback Tool for Nasal Surgery
Revolutionary software aims to assist surgeons in visualizing and enhancing the accuracy of septoplasty procedures. By predicting surgical scissor line-of-cut from training data and generating real-time visualizations of the process, this tool revolutionizes the learning environment for residents in
0 views • 17 slides

Geometrical Constructions and Solutions in Mathematics
Explore a variety of geometrical constructions and solutions in mathematics, including elementary algebraic sentences, harmonic division of a segment, the Apollonian problem, and Lemoines Construction. These visualizations illustrate complex and exact methods used in geometric problem-solving, such
0 views • 12 slides

Graphs: Visualizations and Representations in Java
Delve into the world of graphs with a focus on visualizations for networks and building up graph representations in Java. Explore different graph representations, adjacency lists, and key-value mappings, along with insights on storing and tracking data efficiently using Java data structures. Dive in
0 views • 12 slides

Active Object Recognition Using Vocabulary Trees: Experiment Details and COIL Dataset Visualizations
This presentation explores active object recognition using vocabulary trees by Natasha Govender, Jonathan Claassens, Philip Torr, Jonathan Warrell, and presented by Manu Agarwal. It delves into various aspects of the experiment, including uniqueness scores, textureness versus uniqueness, and the use
0 views • 49 slides
The Divided States of America: A Look at Party Polarization
The images depict the growing party polarization in American politics, showing the widening gap between Republicans and Democrats since the 1980s. The data visualizations illustrate how the ideological divide has evolved over the years, culminating in high levels of animosity and competition between
0 views • 48 slides

Project Update Meeting Highlights
This document outlines the key points discussed in the recent project update meeting, including the agenda, project context, problem statement or opportunity, project vision or objective, and updates on the project's progress. It also covers important aspects such as project outcomes, completed key
1 views • 18 slides

Enhancing Memory with the Memory Journey Technique
Explore the concept of the Memory Journey as a powerful method for memorizing information efficiently. Discover how this technique leverages our senses, such as smell and visual memory, to create vivid memory associations. Follow along step-by-step with visualizations involving your home, family, an
0 views • 29 slides

Bathymetry Trackline Fitting Techniques at ACM SIGSPATIAL GIS 2009
Tsz-Yam Lau, You Li, Zhongyi Xie, and W. Randolph Franklin presented various ship trackline fitting techniques at the ACM SIGSPATIAL GIS 2009 conference in Seattle. The study explored methods such as Inverse Distance Weighting, Kriging, Voronoi, Linear Spline, Quadratic Spline, and more for bathymet
0 views • 12 slides
Challenges in Explaining the Data: A Research Agenda for the Future
Explore the complexities of explaining data, from understanding causality to interactive processes and visualizations. Judea Pearl's work on causality and Halpern's foundational research shape the emerging science of explaining data, highlighting the limitations and challenges faced by data analysts
0 views • 5 slides

Analysis of College Data Trends for Strategic Planning
This report by Dr. Mary Schaal delves into key data trends for strategic planning in a college setting. It covers aspects such as student enrollment, attendance, ethnicity, age demographics, and course success by delivery mode. The data visualizations provide insights into patterns and changes over
0 views • 15 slides

FOLIO Roadmap and Prioritization Update
This update highlights the roadmap prioritization process for the FOLIO Community Development Roadmap. It includes the key components addressed by the Prioritization and Roadmap Working Group, high-level functional areas, team members, 18-month roadmap overview, covered releases, and the teams/devel
0 views • 20 slides
Insights from TDL Open Source Project Meetings
Detailed insights from recent TDL Open Source Project meetings, including discussions on project structure, roles and responsibilities, decision-making processes, and contribution workflows. The meetings covered topics such as setting project policies, coordinating technical activities, IP complianc
0 views • 20 slides
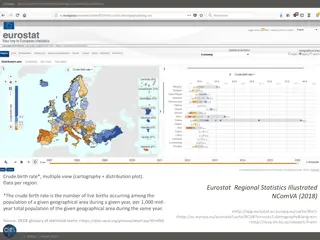
Visualization of Crude Birth Rates in European Regions
Explore the visualization of crude birth rates in different European regions using cartography and distribution plots. The data, sourced from Eurostat Regional Statistics, illustrates variations across regions, with France showing both the lowest and highest rates relative to other European countrie
0 views • 4 slides

MHCLG Online Data Dashboard - Empowering Better Decision Making
Revolutionize the way data is accessed and utilized within the MHCLG through the Online Data Dashboard. This comprehensive tool provides easy access to performance metrics, visualizations, and key outcomes across various policy areas. From tracking progress to enabling policy development and enhanci
0 views • 11 slides

Utah Real Estate Trends and Statistics Analysis
Explore a comprehensive collection of data visualizations depicting the annual average rate of change, percent change, median sales prices, income distribution, and more in Utah's real estate market from 1991 to 2017. The visuals offer insights into the shifts and trends in the housing sector over t
0 views • 18 slides
Turning Data Into Decisions: Using Dashboards for Coordinated Entry Planning
Explore the journey of creating a dashboard for Coordinated Entry Planning in Minnesota, from identifying the need for a more interactive tool to refining visualizations for better decision-making. Learn about technical considerations, design feedback rounds, and final steps towards a beta release.
0 views • 16 slides
![Project Initiation Document for [Insert.Project.name] [Insert.Project.number]](/thumb/226757/project-initiation-document-for-insert-project-name-insert-project-number.jpg)
Project Initiation Document for [Insert.Project.name] [Insert.Project.number]
This project initiation document outlines the strategic fit, benefits, delivery schedule, specific risks, cost breakdown, project overview, delivery timelines, and key project information for [Insert.Project.name] [Insert.Project.number].
1 views • 19 slides

Critical Path Method in Project Management
Critical Path Method (CPM) is a vital tool in project management for determining the longest sequence of tasks essential to complete a project within a specified timeframe. This method helps project managers identify tasks critical to project completion and allows for efficient scheduling and resour
2 views • 60 slides

Support to Ukraine Public Transport Project - Project Procedure Manual (PPM) Kick-off Meeting
The support to the Ministry of Infrastructure for the Ukraine Urban Public Transport Framework Loan Project kick-off meeting involved the presentation and discussion of the Project Procedure Manual (PPM), detailing the purpose, institutional organization, stakeholders, and procedures for the success
0 views • 26 slides

Insights into Mongolia: Data Visualizations and Trends
Explore a collection of informative data visualizations and charts highlighting various aspects of Mongolia, including population demographics, economic growth, urbanization, gender gaps in education and labor force, and more. Gain valuable insights into Mongolia's people, culture, and key statistic
0 views • 13 slides