Easy Data Analysis & Business Intelligence with Excel Power Tools
Dive into the world of data analysis and business intelligence with Excel Power Tools. Learn how to convert data into actionable insights, create reports and visualizations, and enhance decision-making processes. Instructor Mike Girvin from Highline College guides you through the fundamentals, providing a solid foundation for beginners. Gain essential skills to transform raw data into valuable information for informed decision-making in the business realm.

Download Presentation

Please find below an Image/Link to download the presentation.
The content on the website is provided AS IS for your information and personal use only. It may not be sold, licensed, or shared on other websites without obtaining consent from the author.If you encounter any issues during the download, it is possible that the publisher has removed the file from their server.
You are allowed to download the files provided on this website for personal or commercial use, subject to the condition that they are used lawfully. All files are the property of their respective owners.
The content on the website is provided AS IS for your information and personal use only. It may not be sold, licensed, or shared on other websites without obtaining consent from the author.
E N D
Presentation Transcript
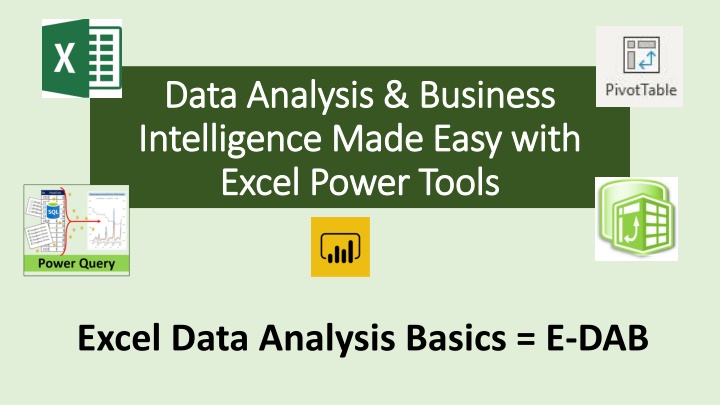
Data Analysis & Business Data Analysis & Business Intelligence Made Easy with Intelligence Made Easy with Excel Power Tools Excel Power Tools Excel Data Analysis Basics = E-DAB
E E- -DAB DAB- -01: Introduction to Class. What is Data Analysis? 01: Introduction to Class. What is Data Analysis? Instructor Scope of Class Version of Excel Define Data Analysis & Business Intelligence Goals of Class Videos Topics Presented In Class Files for you to Download What You Will Gain After Taking This Class
Instructor: Mike Girvin Highline College Instructor Microsoft Excel MVP 2013-present excelisfun YouTube Channel 2008 present +3000 Video, +100 classes/playlists
Scope of Class Scope of Class Introduction to Data Analysis For People With No Experiences With Data Analysis Learn how to turn data into useful information and insight Pre-Requisite for the Advanced Data Analysis class here at the excelisfun YouTube Channel: MSPTDA
Version of Excel What Version of Excel: Excel Office 365 What Version of Power BI Desktop: Free Download
Define Data Analysis & Business Intelligence Data Analysis: Convert Data into Useful Information for Decision Makers Business Intelligence: Convert Data into Useful/Actionable/Refreshable Information for Decision Makers in a Business Situation The Business is Intelligent because it is making decisions based on Data! Both Help To: See Trends & Patterns Answer Questions & Gain Insight Short Definition for both: Data Information
Goal of Data Analysis and Business Intelligence Goal of Data Analysis and Business Intelligence Create useful, updateable, actionable information for decision makers in the form of reports, visualizations and dashboards.
Goal of Data Analysis and Business Intelligence Goal of Data Analysis and Business Intelligence Create useful, updateable, actionable information for decision makers in the form of reports, visualizations and dashboards.
Goals of Class Goals of Class Introduction to these Excel Power Categories: Excel Spreadsheet Formulas & Features Standard PivotTables Power Query (in both Excel and Power BI Desktop) Data Model PivotTables using Excel Power Pivot Data Model Visualizations using Power BI Desktop
Goals of Class Goals of Class Introduction to these Specific Data Analysis Power Tools in Excel Office 365: Sort Filter Excel Table Feature Spreadsheet Functions like: SUMIFS, COUNTIFS and AVERAGEIFS Office 365 Dynamic Arrays Standard PivotTables & Slicers Charts & Visualizations Power Query VLOOKUP Spreadsheet Function Relationship Feature Power Pivot Data Model DAX Functions like: SUMX, AVERAGEX, RELATED and COUNTROWS Power BI Desktop
Goals of Class Goals of Class Introduction to Data Analysis Terms and Processes, such as: Data Proper Data Set Delimiter Relationships ETL Data Model Columnar Database Dashboard More
Goals of Class Goals of Class Perform these Data Analysis Steps: Import Data Clean & Transform Data Build Data Model Build Reports, Visualizations and Dashboards that Deliver Useful Information When New Data Arrives, Refresh Information Assess Usefulness of Information Repeat Earlier Steps
Videos Topics Presented In Class E-DAB-01: Introduction to Class. What is Data Analysis? E-DAB-02: Data, Proper Data Sets, Excel Tables, Sorting, Filtering & Logical Tests E-DAB-03: Summary Reports with Excel Spreadsheet Formulas E-DAB-04: Summary Reports with Standard PivotTables & Slicers E-DAB-05: Visualizations: Tables, Charts, Conditional Formatting & Dashboards E-DAB-06: Clean, Transform & Import Data with Power Query E-DAB-07: VLOOKUP Spreadsheet Function to create a Worksheet Data Model E-DAB-08: Relationship Feature to Create Power Pivot Data Model E-DAB-09: Power Query & Power Pivot for Big Data E-DAB-10: Power BI Desktop E-DAB-11: Excel & Power BI Together
Final Video Titles: Final Video Titles: E-DAB 1: What is Data Analysis & Business Intelligence? E-DAB 2: Data, Proper Data Sets, Excel Tables, Logical Tests, More E-DAB 3: Excel Spreadsheet Formulas Old School? Or Dynamic Arrays? E-DAB 4: PivotTables & Slicers to Create Dashboards & Summary Reports E-DAB 5: Visualizing Data w Tables, Charts, Formatting & Dashboards E-DAB 6: The Magic of Power Query to Import, Transform & Load Data E-DAB 7: Data Modeling: Excel Formulas, Power Query, Power Pivot? E-DAB 8: Power Pivot: Big Data, Data Modeling, DAX & Dashboard E-DAB 9: Power BI: Interactive Visualizations E-DAB 10: Excel & Power BI Together to create Combined, Sharable Dashboards
Downloadable Files and Practice Problems Downloadable Files and Practice Problems Excel Files Power BI Files Source Data Files Practice Problems Pdf Notes from Class Video
What You Will Gain After Taking This Class Have experience with all the Power Tools in Excel used for Data Analysis. Be able to take data and convert it into refreshable reports, visualizations and dashboards that can be used for decision making. Have the introductory level skills to move on to the more advanced Data Analysis and Business Intelligences classes taught for free at YouTube my Mike excelisfun Girvin: Excel Basics (Calculations & Data Analysis) Highline College Advanced Excel Highline College BI 348 Microsoft Power Tools for Data Analysis Dynamic Array Playlist
Links to other classes Links to other classes Full excelisfun Channel at YouTube: https://www.youtube.com/user/excelisfun Excel Basics (Calculations & Data Analysis) https://www.youtube.com/playlist?list=PLrRPvpgDmw0n34OMHeS94epMaX_Y8Tu1k Highline College Advanced Excel https://www.youtube.com/playlist?list=PLrRPvpgDmw0lcTfXZV1AYEkeslJJcWNKw Highline College BI 348 Microsoft Power Tools for Data Analysis https://www.youtube.com/playlist?list=PLrRPvpgDmw0ks5W7U5NmDCU2ydSnNZA_ 1 Dynamic Array Playlist https://www.youtube.com/playlist?list=PLrRPvpgDmw0nwgWhZjKjqnAwfZBxLcsxx