Analyzing Shot Location Trends in the NBA
 undefined


The Effect of Shot Location
Trends in the NBA
MICHAEL DICKEY AND JUSTIN POST


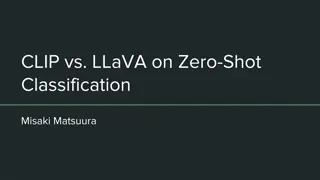
Data Used
◦
Shot charts for every NBA team since
1996-’97 season are made publicly
available from Stats.NBA.com
◦
Underlying JSON data taken via a script
written in R
◦
Data has important information such as
the exact x-y coordinates of all shots
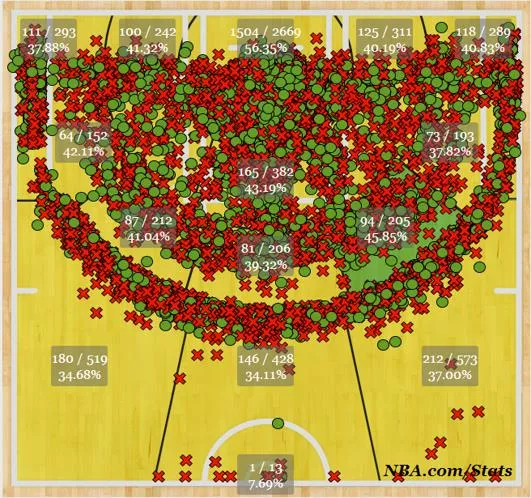
A shot chart of 2013-’14 Atlanta Hawks
via NBA.com/Stats showing all shots taken
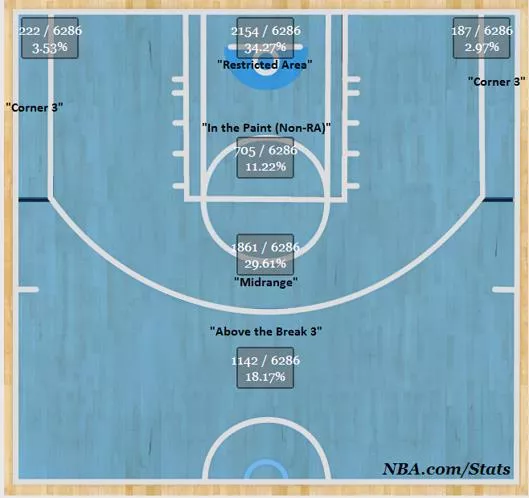
Shot chart of 2007-’08 Boston Celtics
showing their proportion of shots taken in
each of the “basic shooting zones”
Questions to Answer:
1.
Have there been shot location trends? If so, what are they?
2.
What teams have been “trendsetters”? Has it translated into success?
3.
What effect has this had on offense in the NBA?
Have there been location trends?
◦
Which shot zones experienced the
most linear growth since 1996?
◦
Midranges shots – strongly negative linear
relationship
◦
Corner 3-pointers – strongly positive linear
relationship
◦
Above-the-break 3-pointers – positive linear
relationship
◦
Weak correlation in other zones
◦
Why is the game changing this way?
◦
Hypothesis: NBA analytics staffs optimizing
efficiency
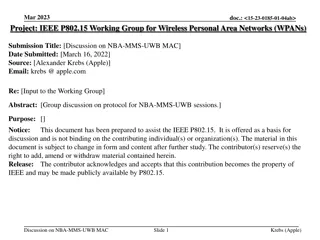
Have there been location trends?
-Visualization
◦
Shot charts were produced
using R to visualize these
trends
◦
Colored grids of the court by their
avg number of points for that season
◦
Plotted points on 100 most popular
grid zones - watch them move
around!
◦
Data accuracy improvement
also apparent in the GIF
Shot chart animation for NBA seasons since 1996-’97
grids colored by the efficiency of that location
(darker red implies a more efficient shot).
Finding the trendsetters…
◦
K-Means Clustering
◦
Goal: Identify groups of teams with most
similar shot distributions (treating each year’s
edition of an NBA team as an observation, i.e.
2007-2008 Boston Celtics)
◦
Defined 4 clusters after maximizing Cluster
Comparison Criterion
◦
Allows for simpler regressions and
different comparisons
Modeling the Cluster’s Shooting Ability
◦
Goal: Accurately determine each clusters shooting
ability (probability of making a shot) in each zone
of the court
◦
Fit a probit regression model with a Continually
Autoregressive Prior
◦
Allows us to account for spatial clustering
◦
Smooths over probabilities in neighboring grids
◦
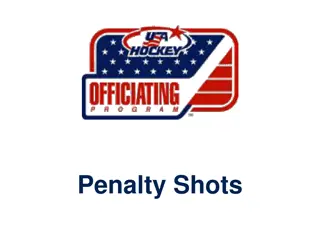
Next slide: Comparison of each cluster’s smoothed
probabilities of making a shot
Before:
After:
Cluster 1
Cluster 2
Cluster 3
Cluster 4
Conclusion: Not many noticeable differences in shooting ability – except for cluster 4 maybe (determined least efficient)
About the trendsetters…
◦
Each cluster or shot distribution, has
a unique value of points per shot
declared by Tukey’s HSD
◦
Less efficient clusters have tended to
disappear while more efficient
clusters have emerged and grown
◦
Trendsetters (first in cluster 2):
◦
1997-’98: LA Lakers, Clippers, Houston
Rockets, Miami Heat, Sonics
◦
Who is against the trend?
◦
Memphis Grizzlies, 4
th
cluster each of last 6
years (made playoffs the last 4 years)
Offensive Efficiency Trends
◦
There are “significant differences” between
each season’s mean Points Per Shot (PPS) by
Tukey’s HSD
◦
Suggests a slight change in shooting efficiency over
time
◦
Could lead to the question: “Is this only
because of shot location or also better
shooting ability?”
“Maybe they’re just shooting better…”
◦
Multiple Linear Regression of % of shots made in each zone
by year:
◦
Significant increase in shooting % across all zones
◦
No interaction between zone/year
◦
Another part of the explanation for why offenses have
improved
Conclusion
◦
Significant changes in where teams tend to shoot the ball.
◦
The league has become more efficient at scoring.
◦
Result of improved shooting ability AND changes in location tendencies
◦
Basic basketball intuition tells us that one shot distribution doesn’t fit all, and even less efficient shots
are necessary for a variety of reasons.
◦
For future research:
◦
Determine how a team’s shot distribution could impact other aspects like defensive efficiency, rebounding, etc..
◦
Determine the optimum shooting distribution for the league or for a given team
Examining shot location trends in the NBA since 1996, this study delves into the impact on offensive strategies. Utilizing shot charts data and visualizations, the analysis uncovers shifts in shooting patterns, correlations, and evolving efficiency. Techniques like K-Means Clustering are employed to identify trendsetting teams and model shooting abilities within distinct clusters, aiming to understand the changing landscape of basketball analytics.

Download Presentation

Please find below an Image/Link to download the presentation.
The content on the website is provided AS IS for your information and personal use only. It may not be sold, licensed, or shared on other websites without obtaining consent from the author.If you encounter any issues during the download, it is possible that the publisher has removed the file from their server.
You are allowed to download the files provided on this website for personal or commercial use, subject to the condition that they are used lawfully. All files are the property of their respective owners.
The content on the website is provided AS IS for your information and personal use only. It may not be sold, licensed, or shared on other websites without obtaining consent from the author.
E N D
Presentation Transcript
The Effect of Shot Location Trends in the NBA MICHAEL DICKEY AND JUSTIN POST
Data Used Shot charts for every NBA team since 1996- 97 season are made publicly available from Stats.NBA.com Underlying JSON data taken via a script written in R Data has important information such as the exact x-y coordinates of all shots A shot chart of 2013- 14 Atlanta Hawks via NBA.com/Stats showing all shots taken Shot chart of 2007- 08 Boston Celtics showing their proportion of shots taken in each of the basic shooting zones
Questions to Answer: 1. Have there been shot location trends? If so, what are they? 2. What teams have been trendsetters ? Has it translated into success? 3. What effect has this had on offense in the NBA?
Have there been location trends? Which shot zones experienced the most linear growth since 1996? Midranges shots strongly negative linear relationship Corner 3-pointers strongly positive linear relationship Above-the-break 3-pointers positive linear relationship Weak correlation in other zones Why is the game changing this way? Hypothesis: NBA analytics staffs optimizing efficiency
Have there been location trends? -Visualization Shot charts were produced using R to visualize these trends Colored grids of the court by their avg number of points for that season Plotted points on 100 most popular grid zones - watch them move around! Data accuracy improvement also apparent in the GIF Shot chart animation for NBA seasons since 1996- 97 grids colored by the efficiency of that location (darker red implies a more efficient shot).
Finding the trendsetters K-Means Clustering Goal: Identify groups of teams with most similar shot distributions (treating each year s edition of an NBA team as an observation, i.e. 2007-2008 Boston Celtics) Defined 4 clusters after maximizing Cluster Comparison Criterion Allows for simpler regressions and different comparisons
Modeling the Clusters Shooting Ability Goal: Accurately determine each clusters shooting ability (probability of making a shot) in each zone of the court Before: Fit a probit regression model with a Continually Autoregressive Prior Allows us to account for spatial clustering Smooths over probabilities in neighboring grids Next slide: Comparison of each cluster s smoothed probabilities of making a shot After:
Cluster 2 Cluster 1 Cluster 4 Cluster 3 Conclusion: Not many noticeable differences in shooting ability except for cluster 4 maybe (determined least efficient)
About the trendsetters Each cluster or shot distribution, has a unique value of points per shot declared by Tukey s HSD Less efficient clusters have tended to disappear while more efficient clusters have emerged and grown Trendsetters (first in cluster 2): 1997- 98: LA Lakers, Clippers, Houston Rockets, Miami Heat, Sonics Who is against the trend? Memphis Grizzlies, 4th cluster each of last 6 years (made playoffs the last 4 years)
Offensive Efficiency Trends There are significant differences between each season s mean Points Per Shot (PPS) by Tukey s HSD Suggests a slight change in shooting efficiency over time Could lead to the question: Is this only because of shot location or also better shooting ability?
Maybe theyre just shooting better Multiple Linear Regression of % of shots made in each zone by year: Significant increase in shooting % across all zones No interaction between zone/year Another part of the explanation for why offenses have improved
Conclusion Significant changes in where teams tend to shoot the ball. The league has become more efficient at scoring. Result of improved shooting ability AND changes in location tendencies Basic basketball intuition tells us that one shot distribution doesn t fit all, and even less efficient shots are necessary for a variety of reasons. For future research: Determine how a team s shot distribution could impact other aspects like defensive efficiency, rebounding, etc.. Determine the optimum shooting distribution for the league or for a given team